Why houses and units perform differently
Many forecasters lump all types of properties and all areas and localities together, as if they always perform the same, but just as one suburb can perform differently from another, the performance of houses and units can vary significantly, even in the same locality.
We’ve produced some heat maps using our patented Housing Market Prediction Solution to compare the forecast growth potential in Sydney Local Government Areas for houses and units during the rest of 2022.
These two heat maps show you that Sydney units and houses, even in the same council areas, are likely to perform very differently over the next nine months.
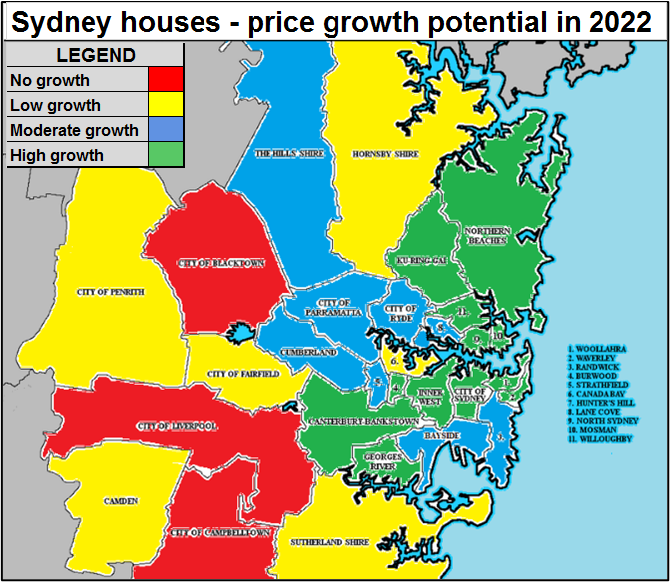
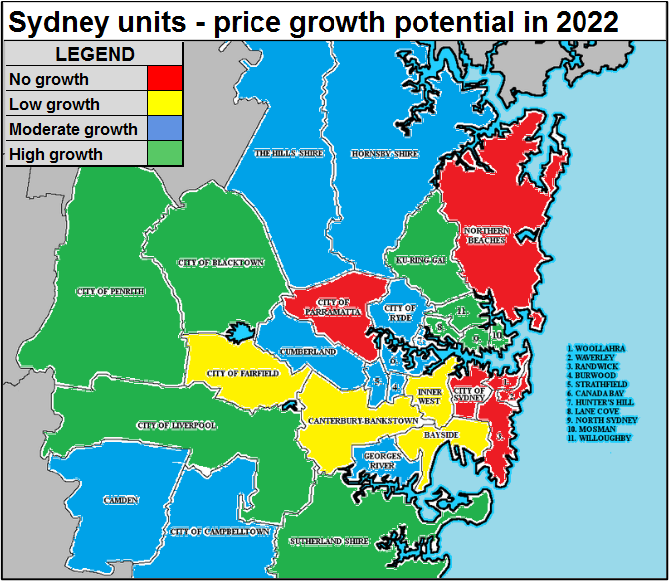
The reason for these variations in their predicted performance is that unit and house markets respond to different dynamics.
For example, most units are investor owned which means that their performance is tied to current and future rental demand. As our international borders reopen, we can expect a huge rise in migrant and refugee arrivals, most of whom will settle in areas near employment opportunities and where rents are more affordable. Rising rents will motivate more investors to buy units in these locations and prices will increase.
On the other hand, eighty per cent of houses and townhouses are purchased as homes. Recent price rises and prospective interest rate increases will cut buyer demand in first home buyer locations, but have less effect in upper socio-economic areas, where price growth is likely to continue.
That’s why houses and units can perform differently in the same area at the same time.