Every investor needs to know when it’s the best time to sell and the right time to buy. Some rely on gut feel or intuition, while others may be motivated by gossip, hearsay or headlines. Rather than relying on such flawed methods, John Lindeman reveals how to find early winning signs of growth, and early warning signs of decline.
Do we buy, sell, or hold? Buying or holding on at the wrong time could lead to huge losses if prices start to tumble and buyers disappear, but it’s just as painful to sell just before a big boom occurs and prices dramatically escalate. So, we need to know whether property prices are likely to boom or bust, but where can we get the right information?
We are bombarded by a seemingly endless array of confusing and even contradictory advice about whether it’s the best time to sell.
We don’t have to read tea leaves or gaze into crystal balls to get an answer, because there are stats out there to help us make the right decision.
Sale prices only reveal the past
Some experts rely on past sales and price trends to forecast the future. After all, it seems logical that falling buyer demand indicates it’s time to get out, while rising buyer demand tells us that it’s best to hold. But, past sales and price information is already months old before it’s published, and market conditions keep changing.
Future performance is likely to be very different from what past sales and prices are showing. It’s like using your rear view mirror to see which way the road ahead is turning.
Rather than looking backwards at past sales, we need to look forwards at potential sales instead. Luckily, this data is available on-line and it’s free.
The early winning sign of growth
Potential sales are called listings, which are provided on public listing sites for all types of property and for any suburb. You can use listings data as an early winning sign, indicating that prices could rise if listings are falling. Here’s an example of how it works.
Sussex Inlet is a beautiful coastal holiday location on the New South Wales South Coast, and it was one of my selections for Your Investment Property’s Annual Top 50 for 2022.
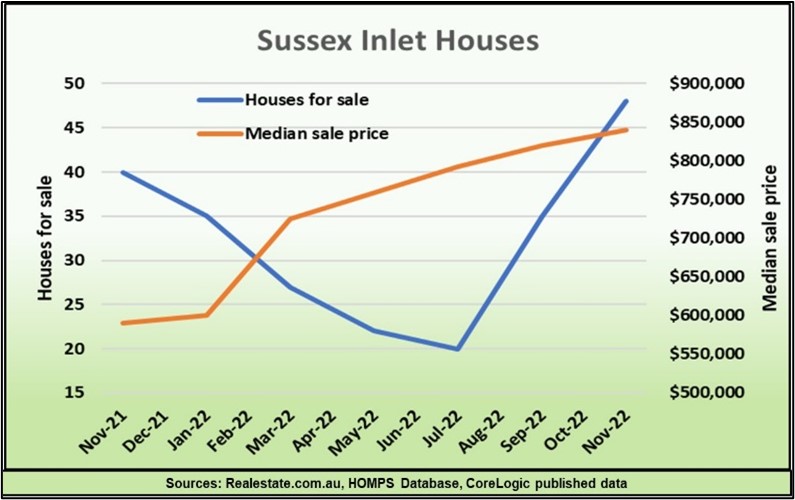
My choice was not only assisted by its popularity as a tourist and retiree destination, but because the number of houses listed for sale had consistently fallen during the second half of 2021, indicating that strong price growth was likely to occur during 2022.
The result? Sussex Inlet was the best performing property market during 2022, experiencing a median price rise of nearly 50%. As the graph shows, price rises occurred because the number of houses listed for sale had been falling every month.
The graph also shows you that the number of houses listed for sale in Sussex Inlet then started to increase in the second half of 2022, and quickly grew higher than they had been before the price boom started.
This was a sign that prices could start to fall again, which they have in recent months.
So, you can also use listings as an early warning sign, telling you that buyer demand is slowing down, and prices may start to stagnate or even decline.
The early warning sign of decline
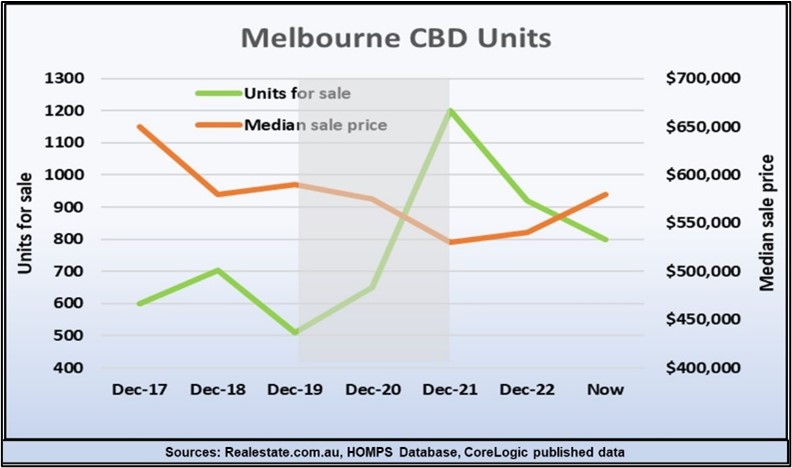
Although our housing markets boomed from 2020 to 2022 during the two years of the pandemic, there were some dramatic exceptions such as the Melbourne CBD unit market, where prices crashed. The graph shows how the listings trend suddenly reversed during 2020, serving as an early warning sign of price falls. Listings continued to increase all through the pandemic years, (highlighted in grey).
This was because lockdowns and border closures resulted in a near total collapse of rental demand in the Melbourne CBD rental market and many investors tried to sell at the same time.
Thankfully, the lockdowns and border closures are behind us, and the graph shows that unit listings in the Melbourne CBD are now rapidly declining.
In fact, the number of units listed for sale is trending down to the boom levels of 2016-17, and sale prices could surge as a result.
Tracking the number of houses or units for sale in a suburb or town is easy, and it’s free. When making those all-important buy, hold or sell decisions, you obviously need to rely on much more data than just the number of listings, but they do give you an early warning sign that prices are likely to decline, or an early winning sign that they have the potential to rise.