Timing Perth's turning points
Perth’s housing market is currently booming, but not all properties or locations are experiencing strong price growth. John Lindeman explains why growing buyer demand is not lifting prices in all areas and what the future holds for owners and investors.
The saying that “a rising tide lifts all ships” is commonly applied to property markets to indicate that when a boom occurs, prices will shoot up everywhere.
The facts are often rather different, and Perth’s property market offers us a good example. Even though house prices have been rising strongly for over a year, not all locations or types of property are participating in the growth wave, as this graph shows.
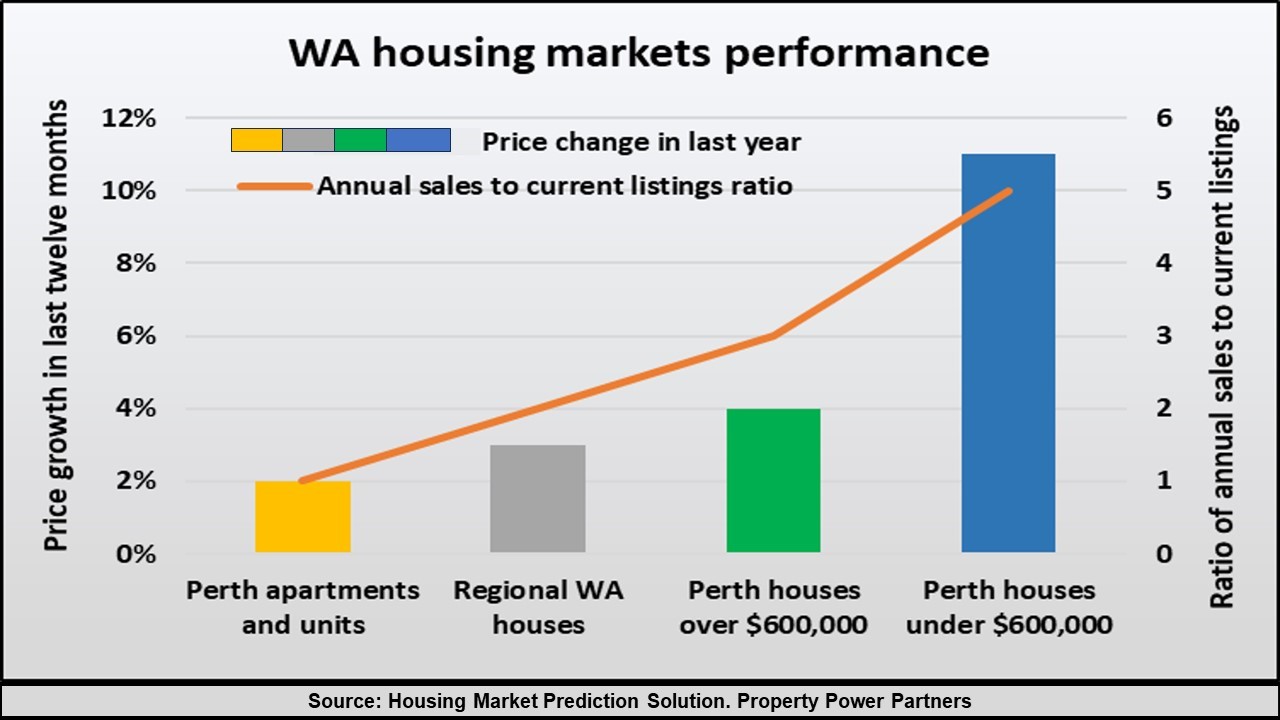
The data provided by our patented Housing Market Prediction Solution reveals that Perth’s unit market was the worst performer of all Western Australian markets, with median prices rising by just two percent in the last twelve months.
Houses in Western Australia’s regional house markets increased in value by just 3%, and house values in Perth’s higher priced suburbs only rose by 4%. The star performers were Perth’s bargain priced house suburbs, where prices grew in value by around 11% over the last year.
The ratio of annual sales to current listings is the key to current performance
The reasons for this difference in performance are revealed when we compare the number of annual sales in each market to the number of current listings. The graph shows that annual sales in Perth’s bargain priced suburbs have been outpacing listings by a ratio of 5:1, while the number of annual unit sales is about the same as the number currently listed for sale, resulting in a balanced ratio of 1:1.
Put simply, this means there are enough units being offered for sale in Perth to meet buyer demand, so there’s no pressure on prices to rise. It’s a very different story with houses in Perth’s bargain priced suburbs, where buyer demand far exceeds the supply of houses on the market. Prices in those suburbs have been rising strongly as many potential buyers compete for the small number of houses listed for sale.
The annual sales to current listings trends enable us to time the turning points
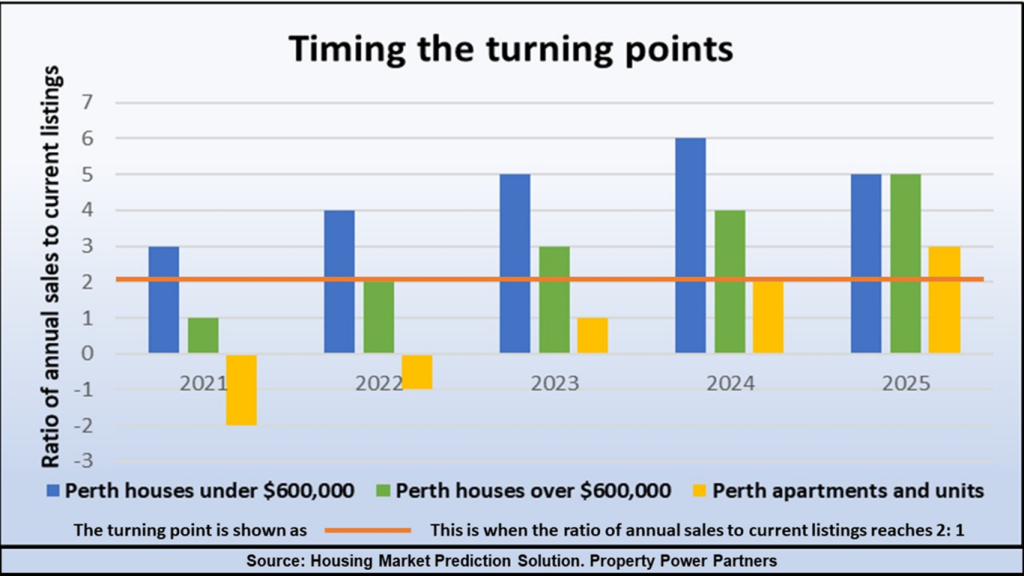
Tracking the annual sales to current listings trends enables us to make some useful estimates of imminent price performance, as this graph shows. It explains why we publicly predicted last year that Perth’s bargain priced suburbs were about to boom.
Looking ahead, we see that the ratio of sales to listings in Perth’s bargain priced house suburbs is trending upwards strongly, indicating that further growth is likely.
Compare this to Perth’s units, which have only just now returned to a balance between demand and supply as the massive overhang of units available for sale due to many years of overdevelopment has been steadily falling.
Timing the turning points enables us to make predictions
Based on these sales to listings ratios and trends, we predict that growth in Perth’s lower priced house markets will continue until at least 2025 and then start to slow down, while price growth in the city’s higher priced suburbs will begin to accelerate over the same time.
The current oversupply of units in Perth is steadily reducing, but real overall price growth will not occur until the sales to listings ratio reaches 2:1, which is not likely until 2024.
Of course, some suburbs will lead the growth charge and others will be laggers, but this analysis does provide an overview of how to make meaningful short term “timing” forecasts.
How accurate is this predictive method?

I first explained how to use the ratio of annual sales to current listings to measure market performance and make short term predictions in my book for property investors titled Mastering the Australian Housing Market, published by Wileys in 2011.
In 2016 I was awarded Australia’s only innovation patent for this forecasting method. It’s called the Housing Market Prediction Solution, which has achieved a consistent past accuracy rate of over 90% in predicting both the direction and intensity of price growth in Australia’s 15,000 suburbs and towns.