Many locations in Australia are heading for what could be their biggest property market boom ever. John Lindeman explains why this is about to occur and which of the sleepers are set to boom.
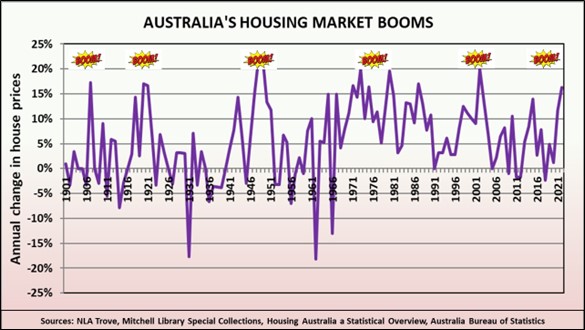
Did you know that we have only ever experienced six housing market booms since our nation began? They are shown on this graph, and they were all generational property market booms, beginning when each new generation decided to buy their first homes at the same time.
All our property market booms have been generational
You can clearly see the Federation boom in the early 1900s, the two post-war baby booms of 1919-1922 and 1947-1951, the baby boomers buying their first homes in the 1970s, the Gen X buying boom in the early 2000s and more recently, the Millennial home buying boom which started during the Covid years.
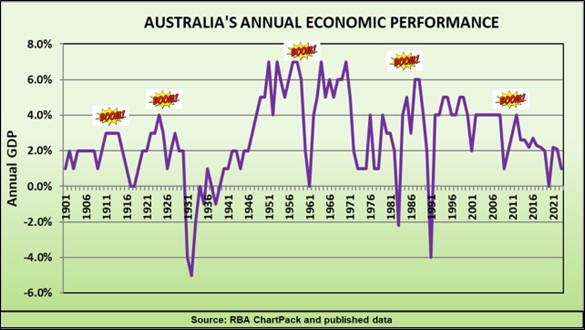
When housing booms, so does our economy
What’s even more significant for investors is that each of these housing market booms has created economic booms. This is because housing demand directly stimulates the financial, construction and business sectors, and indirectly generates around one quarter of our economic growth.
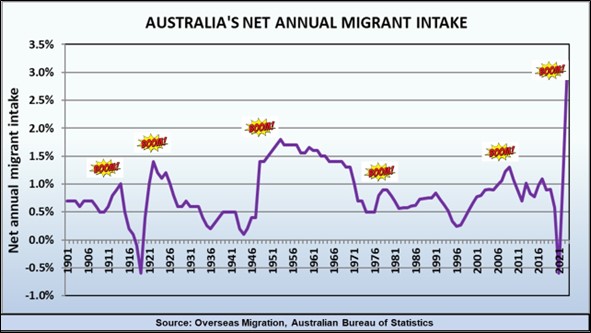
When the economy booms, so does migration
Because of our relative isolation, Australia has been able to avoid the direct impact of wars, social unrest, economic crises and other disasters experienced in other parts of the world. When such catastrophes occur elsewhere, we are seen as a peaceful and prosperous safe haven and huge numbers of migrants and refuges decide to start new lives here.
As the graph shows we are once again receiving record numbers of permanent overseas arrivals from economically and socially troubled parts of the world and this trend is likely to increase over the next few years.
These new arrivals not only generate more demand for housing, they also stimulate our economy by creating new business enterprises. There has always been a strong connection between migration, economic growth and housing market booms, but the third graph shows that we have yet to reach this point, because our international borders have only been open for a relatively short time.
Housing prices can double in a few years
In every one of the five property market booms that Australia has experienced before the last boom, housing prices more than doubled in just a few years. So all the conditions for another boom are in place – we have just experienced the Millennial home buying surge and are in the middle of a massive migrant intake.
As my three graphs indicate, we can now look forward to an economic boom kicking off, followed by the potential for property prices to double in the next few years. Even though house prices have slumped in recent months, we are still in the beginnings of a housing market boom.
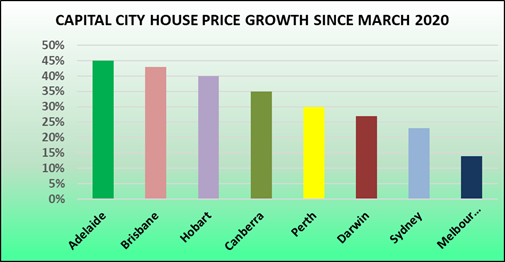
As the graph shows, property prices are well ahead of where they were when the current boom started in 2020. In some cities, such as Perth and Adelaide, housing prices are currently at record highs, while the average capital city growth since March 2020 is 25 per cent.
Even though every capital city has experienced price growth over the last three years, the variations extend not just between cities, but to their suburbs as well, with some locations booming while others have experienced little to no growth at all.
Locations which suffered most will have the greatest growth potential
In years to come, the current slowdown will be just a tiny dip in a sea of price growth and investors have a unique opportunity to benefit.
This is because the locations with the greatest potential will be those which suffered most during the lockdowns and border closures.
As the dynamics of our housing markets undergo a complete reversal, those locations which experienced years of low demand with little to no price and rent growth will be sleepers set to boom.
Every investor needs to know when it’s the best time to sell and the right time to buy. Some rely on gut feel or intuition, while others may be motivated by gossip, hearsay or headlines. Rather than relying on such flawed methods, John Lindeman reveals how to find early winning signs of growth, and early warning signs of decline.
Do we buy, sell, or hold? Buying or holding on at the wrong time could lead to huge losses if prices start to tumble and buyers disappear, but it’s just as painful to sell just before a big boom occurs and prices dramatically escalate. So, we need to know whether property prices are likely to boom or bust, but where can we get the right information?
We are bombarded by a seemingly endless array of confusing and even contradictory advice about whether it’s the best time to sell.
We don’t have to read tea leaves or gaze into crystal balls to get an answer, because there are stats out there to help us make the right decision.
Sale prices only reveal the past
Some experts rely on past sales and price trends to forecast the future. After all, it seems logical that falling buyer demand indicates it’s time to get out, while rising buyer demand tells us that it’s best to hold. But, past sales and price information is already months old before it’s published, and market conditions keep changing.
Future performance is likely to be very different from what past sales and prices are showing. It’s like using your rear view mirror to see which way the road ahead is turning.
Rather than looking backwards at past sales, we need to look forwards at potential sales instead. Luckily, this data is available on-line and it’s free.
The early winning sign of growth
Potential sales are called listings, which are provided on public listing sites for all types of property and for any suburb. You can use listings data as an early winning sign, indicating that prices could rise if listings are falling. Here’s an example of how it works.
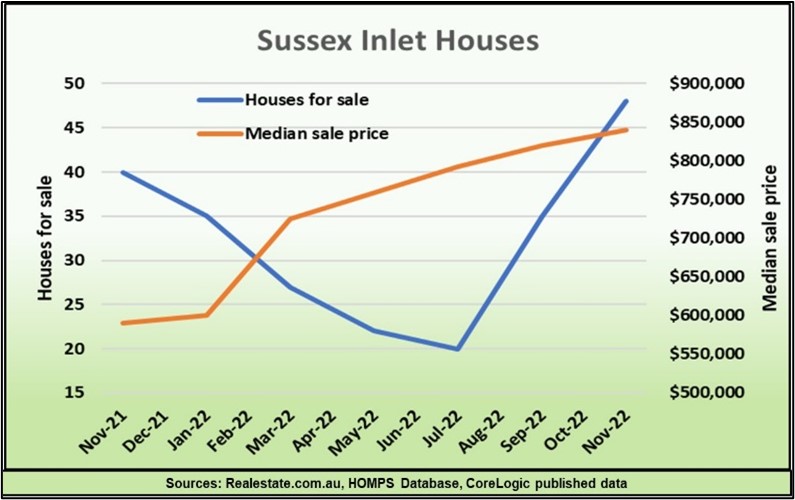
Sussex Inlet is a beautiful coastal holiday location on the New South Wales South Coast, and it was one of my selections for Your Investment Property’s Annual Top 50 for 2022.
My choice was not only assisted by its popularity as a tourist and retiree destination, but because the number of houses listed for sale had consistently fallen during the second half of 2021, indicating that strong price growth was likely to occur during 2022.
The result? Sussex Inlet was the best performing property market during 2022, experiencing a median price rise of nearly 50%. As the graph shows, price rises occurred because the number of houses listed for sale had been falling every month.
The graph also shows you that the number of houses listed for sale in Sussex Inlet then started to increase in the second half of 2022, and quickly grew higher than they had been before the price boom started.
This was a sign that prices could start to fall again, which they have in recent months.
So, you can also use listings as an early warning sign, telling you that buyer demand is slowing down, and prices may start to stagnate or even decline.
The early warning sign of decline
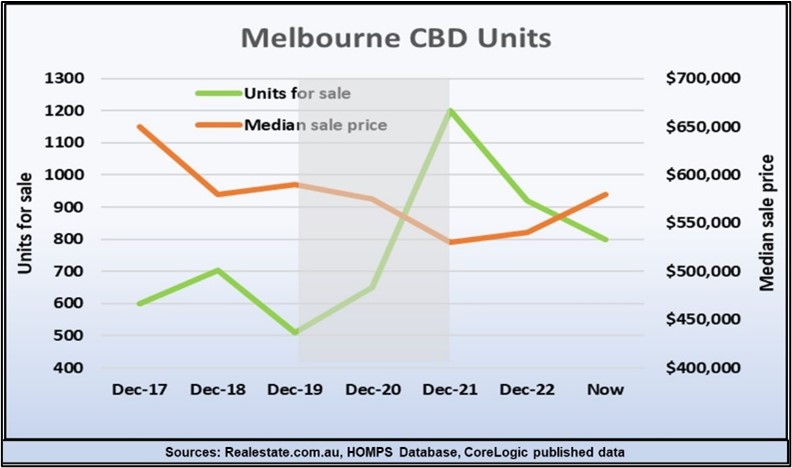
Although our housing markets boomed from 2020 to 2022 during the two years of the pandemic, there were some dramatic exceptions such as the Melbourne CBD unit market, where prices crashed. The graph shows how the listings trend suddenly reversed during 2020, serving as an early warning sign of price falls. Listings continued to increase all through the pandemic years, (highlighted in grey).
This was because lockdowns and border closures resulted in a near total collapse of rental demand in the Melbourne CBD rental market and many investors tried to sell at the same time.
Thankfully, the lockdowns and border closures are behind us, and the graph shows that unit listings in the Melbourne CBD are now rapidly declining.
In fact, the number of units listed for sale is trending down to the boom levels of 2016-17, and sale prices could surge as a result.
Tracking the number of houses or units for sale in a suburb or town is easy, and it’s free. When making those all-important buy, hold or sell decisions, you obviously need to rely on much more data than just the number of listings, but they do give you an early warning sign that prices are likely to decline, or an early winning sign that they have the potential to rise.
During the COVID-19 pandemic years our government battled to keep the economy in growth despite lockdowns and border closures by creating massive amounts of new money. We are about to experience the legacy of this strategy in the form of higher interest rates, inflation and rising housing prices.
At the onset of the pandemic, most economists and analysts believed that lockdowns and border closures would send our economy into recession.
Huge fiscal stimulus packages were rolled out, designed to keep the economy ticking along until the crisis was over. The government pumped one trillion dollars of newly minted money into the economy, created by and then borrowed from the Federal Treasury at historically low interest rates.
The resulting relief schemes gave welcome financial support to workers and businesses and while much of this largesse was deemed necessary, our economy is now awash with nearly one trillion worth of dollars that didn’t exist before the pandemic.
This time it was going to be different
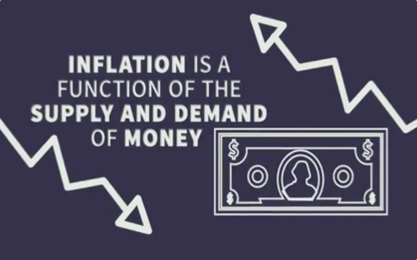
Printing more money has always led to higher inflation, but this time, the experts assured us, the huge amount of “quantitative easing”, (which is what economists call money printing) would not lead to inflation. The reason was because it was designed to keep the economy in growth, rather than generating more spending power.
Although we were assured it would be different this time, basic economics dictates that creating money causes more demand. Without more supply, inflation is the result. The trillion dollars of new money washing around our economy will continue to generate inflation until inflation itself slows down the level of demand.
Since its creation in 1959, the Reserve Bank’s mantra has been to control inflation, but its only tool is the cash rate, which sets benchmarks for home loan interest rates. This means that whenever inflation rises, interest rates follow. Right now, these two unwelcome newcomers are once again impacting the property market, but what is the likely outcome for housing prices over the next few years?
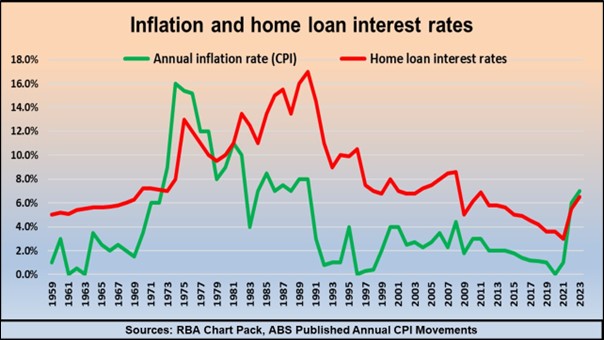
Inflation and housing interest rates are linked
The Reserve Bank has always used interest rates to control inflation, and the first graph shows how this has led to home loan interest rates and inflation being closely linked since the Reserve Bank was created in 1959. You can also see that interest rate movements have tended to lag behind inflation changes by at least a year.
The lag in interest rate rises shows how the Reserve Bank has reacted to changes in inflation rather than trying to anticipate them – except for the last nine rate rises. This time around, interest rate rises have coincided with increases in inflation. This could mean that the bank believes that interest rates are far too low, or it may be that the RBA expects inflation to rise more quickly than previously anticipated, or it could signify both.
The graph also demonstrates that since the nineteen seventies, home loan interest rates have always been higher than the prevailing inflation rate – except for right now. This also means that interest rates may rise further, at least until the rate of inflation reduces.
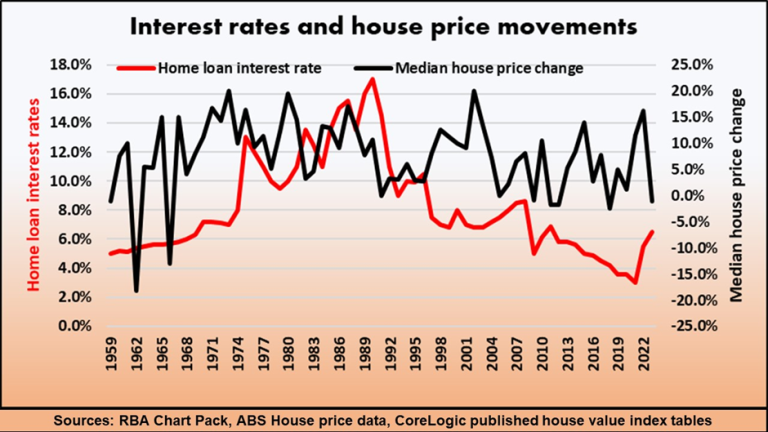
Interest rates have never had a long term impact on housing prices
This next graph shows that higher interest rates, which at times exceeded thirteen percent during the seventies and eighties, had no negative impact on house prices. In fact, even during the worst periods of high interest rates, housing prices rose annually by ten percent and more.
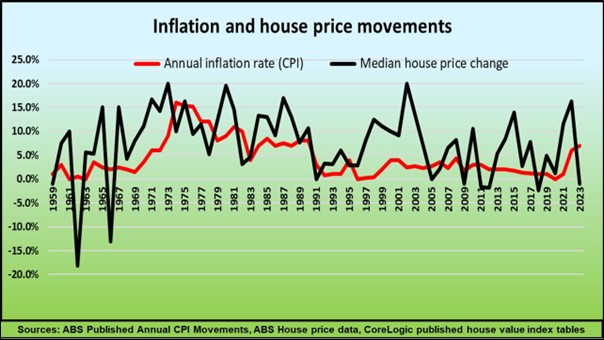
The reason for this apparent contradiction is that housing prices are influenced by inflation significantly more than they are by interest rates. The next graph shows the close correlation between inflation and house price movements. The reason for this is that inflation affects all households, whether they are homeowners, renters or potential buyers, but only a small percentage of households are seriously impacted by higher interest rates.
One third of our dwellings are fully owned without any mortgage, while another third are owned by investors who can claim interest costs as a tax deduction and can also recoup them from tenants by periodically increasing the rent. According to the ABS, the total value of mortgage debt is only twenty percent of the value of all residential property and only around ten percent of homeowners are recent buyers who are now paying higher interest rates than when they purchased their homes.
This explains why interest rate movements normally don’t play a large part in house price changes, but also prompts us to ask why the recent rises in interest rates have led to house price falls.
How the housing market is likely to perform over the next few years
The reason that housing prices have been falling in many locations is because the market is in a state of shock after we were assured that there would be no rate rises until this year, and were then slugged with a record number of consecutive interest rate rises.
This has led to a widespread fall in buyer confidence, even in areas where most buyers are investors, upgraders or downsizers and as such, are relatively immune from rate rises. This pessimistic outlook will quickly dissipate once interest rates stabilise in future.
In coming years, house prices are far more likely to perform in line with inflation, along with other goods, services, incomes and outgoings. As far as the property market is concerned, higher inflation will lead to higher housing prices and this will become the most enduring legacy of the pandemic.
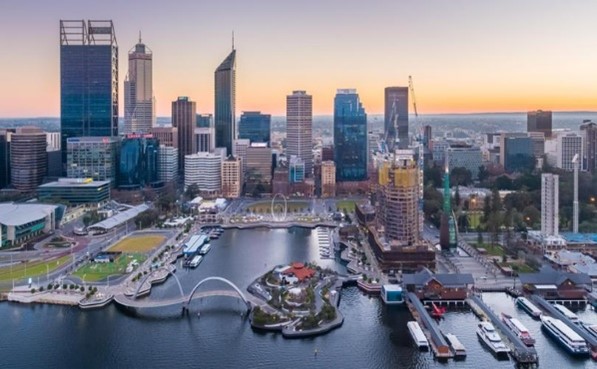
According to property market analyst John Lindeman, all the indicators are pointing to an imminent Perth housing market boom. A thriving economy, massive labour shortages, huge population growth forecasts, the most affordable buy prices of any State capital city, plus an acute and increasing shortage of accommodation.
Australia is such a vast and varied continent that property market booms can always be found somewhere. When market slowdowns occur as they have in most areas over the last six months, we only need to look for other markets which have the potential to boom while the others are in gloom.
Right now, Perth is the standout property market for investors, with our highly accurate and patented housing market prediction solution forecasting both positive cash flow and strong price growth for the city.
This prediction was supported by our recent on the ground research trip to Perth. We discovered a positive and vibrant city ready to boom.
Western Australia’s economy is booming
Underpinning our boom prediction is the Western Australian economy, which is going gangbusters. The State generates half of Australia’s resources export income from iron ore, petroleum, gas, gold, nickel and other minerals. With China buying one third of our exports, the Western Australian economy stands to be the biggest beneficiary of any improvement in trading relations with China, so it’s encouraging that the Australian government is actively patching up diplomatic relations with China.
There is a massive shortage of workers
The State’s growing economy has led to a massive shortage of workers, especially in Perth. The State has one of the lowest rates of unemployment at 3.4% and the highest participation rate of all our States. For the first time in recorded history, there are more advertised job vacancies in Perth than there are people looking for work. These figures indicate that the State needs more workers, and needs them urgently.
High population growth is forecast
As a result of the acute labour shortage, the State Government is actively promoting Western Australia as a destination for skilled work regional migrants (491 Visas) and has successfully lobbied to have all of the State declared a designated regional area.
This means that skilled migrants on regional 491 visas can arrive, live and work in Perth, the only capital city which has achieved this distinction. In addition, the government has waived Visa application fees, dramatically increased the list of available occupations, removed the requirement for applicants to demonstrate that they have sufficient means of support on arrival, and reduced minimum English competency levels.
A massive rental accommodation crisis is looming
Perth is already experiencing a shortage of rental vacancies, with rental vacancy rates below one percent, but according to the government’s Western Australia Tomorrow forecasts, the State is expected to receive 25,000 net overseas arrivals each year, most of whom will be renters.
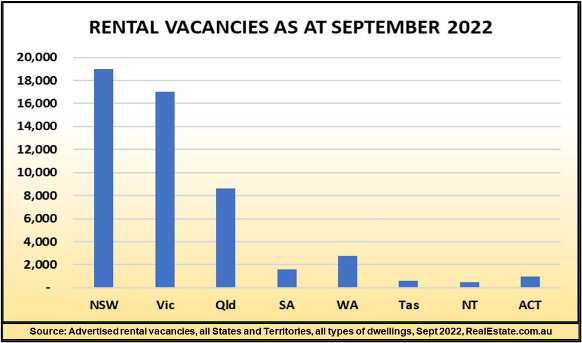
According to Realestate.com.au, there are currently only 2,100 advertised rental vacancies in Perth, and just 2,800 in all of Western Australia, which includes all types of dwellings.
This indicates that a massive rental supply issue is about to hit Perth as new arrivals and others looking for accommodation will have to compete for the few available rental properties.
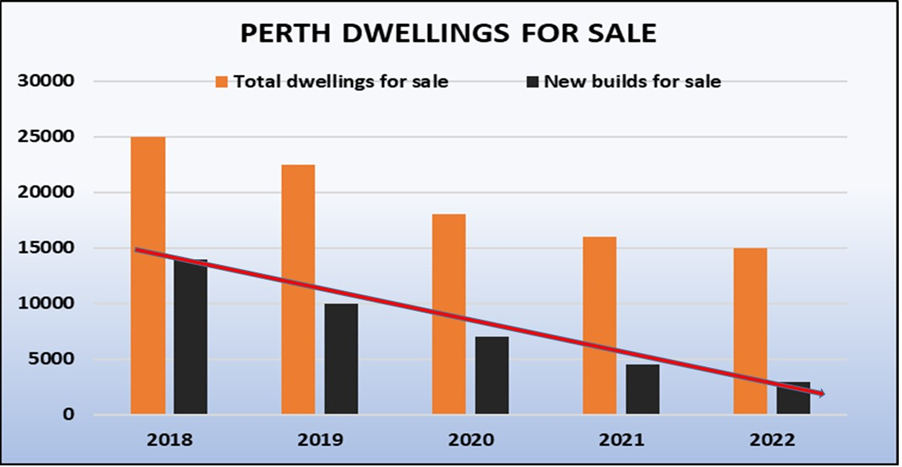
Perth has a huge housing supply shortage
Not only does Perth have an imminent rental supply issue, but there is a general shortage of new housing stock. Because property values have not grown in the last eight years, it is now far cheaper to buy an established house in Perth than to purchase a new build with similar features.
The rate of new builds has reduced so much, however, that the market has reached a turning point, with not enough new dwellings listed for sale to meet buyer demand. At the current rate buyer demand, Perth only has three months of stock available on the market and property buyers are being forced to compete for established dwellings, pushing prices up.
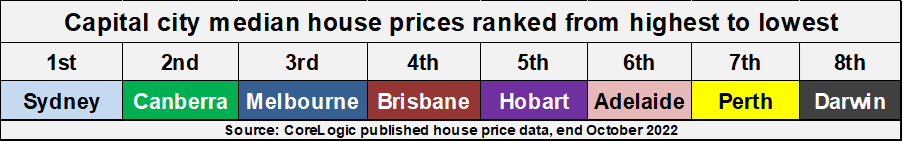
Perth’s housing market is less susceptible to interest rate hikes
With most buyers in a state of shock following seven consecutive rate rises, the impact is likely to be far less in locations where buyers need to borrow less to purchase a property. When we order capital cities by their median house prices, we see that Perth is currently ranked seventh, which is the lowest it has ever been and the first time that Adelaide’s median house price has been higher than Perth’s.
Perth’s comparatively low buy prices not only lessen the impact of higher interest rates, but they will also attract both local and interstate investors. Asking rents will soon turn Perth into the only city with positive cash flow opportunities and this will be followed by a massive lift in housing prices, as investors and home buyers compete to purchase properties.
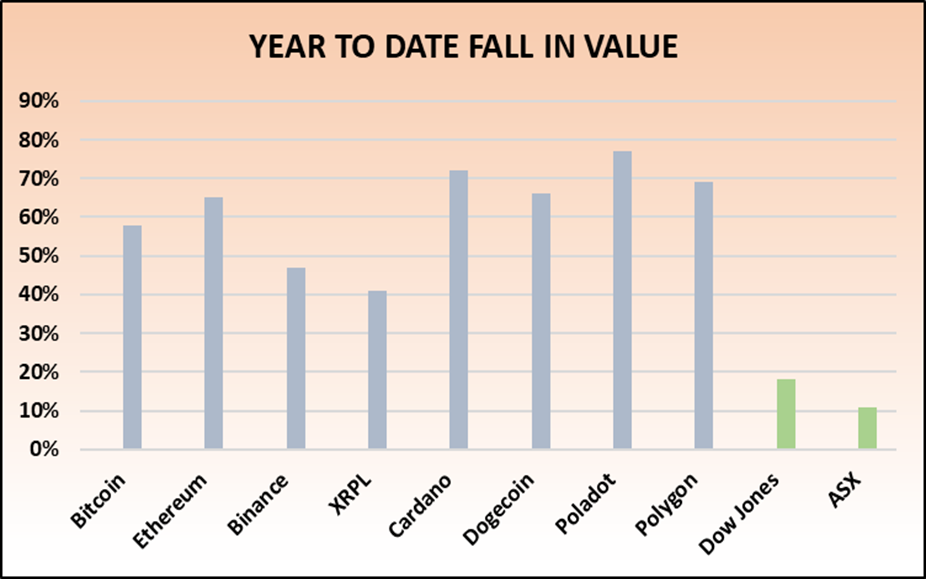
Many investors are tinkering with cryptocurrencies and wondering where they fit in a properly balanced portfolio. John Lindeman reveals their true place in the investment matrix, and explains how they are likely to perform in future.
Bitcoin was promoted as “digital gold” after a meteoric rise in price following its launch around fifteen years ago. Despite some spectacular crashes, cryptocurrency advocates still insist that they are a secure form of investment, being high tech, innovative, blockchain based and disruptive.
This conveniently ignores their extremely volatile recent performance. For example, Bitcoin’s price has swerved from a high of $93,385 to a low of $25,663 in the last twelve months, and this highly volatile performance gives investors no real clue to its potential performance. It is clear that cryptos do not perform like gold, savings or property, so how can investors make informed trading decisions?
Crypto investors are increasingly using the stock market as a guide
Without any reliable forecasting guide, cryptocurrency investors are reacting to market indicators such as inflation, interest rates and investor confidence in the same way that stock market investors do. This is because shares and cryptos have many features in common, such as the ease, speed and low cost of trading, plus of course, their volatility.
The result is that more cryptos are purchased when investors are buying shares, and more are sold when share investors are also selling.
So, cryptocurrencies are starting to perform as if they were pseudo shares, but there’s one crucial difference between cryptos and shares.
Shares represent real equity, not virtual keys and wallets
Shares represent equity in a company, so you are “sharing” ownership of the company itself. The better that a company performs, the more investors will compete to buy its shares. But, when you buy cryptocurrency, you don’t own anything other than a private key and a digital wallet, so the value of your investment is controlled entirely by notional demand or the lack of it.
This means that while the direction of crypto prices will generally mirror that of the stock market, the intensity of change is likely to be much greater, which is exactly what we have witnessed this year.
The graph shows that year to date falls in major crypto prices have been far more severe than those experienced by the Dow Jones or ASX.
The growing link between share prices and cryptos indicates that any stock market recovery should be accompanied by a massive rise in the price of many cryptos, but which ones? There’s no guarantee that yours will be one of them. This is why Investors should treat cryptos as a high risk boom-bust investment option, offering the same wild roller coaster rides as speculative shares which are bought on hope rather than sustainable business models.
Many investors are wary of buying properties in areas with a high percentage of rentals, perceiving them as being low income, socially disadvantaged areas with high levels of unemployment and public safety issues.
But, is there really any logic to this anti-rental stigma? Such negative thinking could even lead some of us to miss out on the huge cash flow bonanza which is about to be unleashed in many of our property markets. The first thing that investors need to understand is that locations with high numbers of renters are often also the most affluent and that for many households, renting is a lifestyle choice.
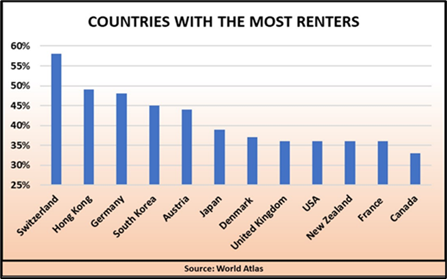
Most renters are young, professional opportunity seekers
This graph shows you that wealthy countries with high per-capita incomes such as Switzerland, Hong Kong, Germany and South Korea, also have the highest percentages of renters.
In some countries such as Switzerland, the number of renting households even outnumbers those of owner-occupiers.
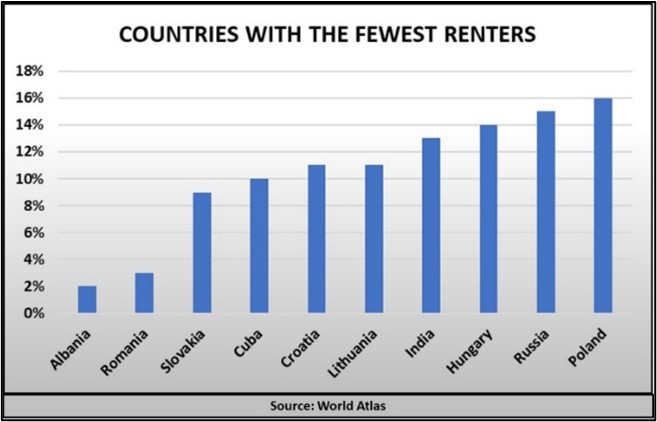
It’s a totally different situation in countries with low numbers of renters, such as Albania, Romania, Slovakia and Cuba which are also low income and even economically challenged.
This would seem to indicate that the higher the percentage of renters in a city, region or country, the more affluent or wealthy it is likely to be.
For example, many high income, aspirational young professionals choose to rent in inner high density suburbs such as Docklands, Southbank, Barangaroo, Fortitude Valley or Newstead because these locations offer a wealth of lifestyle, employment, education and entertainment options not available elsewhere. Not only is it cheaper for them to rent than buy, but they can live in an apartment which they could never afford to purchase anyway.
It’s critical that the numbers of the right types of renters is growing
While investing in an area which has the right type of renting households is important, it is also essential that their numbers are likely to increase, because this leads to rental shortages and rising rents.
Since February our international borders have been progressively opened to overseas arrivals, a process which was significantly increased at the recent Jobs and Skills Summit, with the announcement of 195,000 applicants to be accepted under the Work Visa process. They will be joined by thousands of Family, Student and Business Visa arrivals. The vast majority of these new arrivals will be young, aspirational opportunity seekers, and definitely the right type of renters.
But when we compare their numbers to the total advertised rental vacancies in each State and Territory for all types of dwellings it is obvious that the numbers don’t stack up.
With only 51,000 rental vacancies in Australia, we are facing a massive rental shortage unlike any seen before.
Such rental crises have been partially resolved in the past by renters reluctantly moving into boarding houses, temporary dwellings, granny flats, caravan and holiday parks, even hotels and motels, but the real solution can only be a massive increase in the supply of new rental accommodation. This turns up another issue, because the locations offering lifestyle, employment and education opportunities sought by renters are usually not the same as those preferred by developers.
As asking rents keep rising, this will generate a massive number of investors seeking high cash flow, but even then it is unlikely that the numbers of investors in inner urban locations will be sufficient to meet future rental demand and a huge cash flow bonanza is highly likely.
Housing markets sometimes produce unexpected and dramatic periods of growth after many years of price stagnation. John Lindeman explains that this occurs when the demand for housing starts to exceed the supply of available properties, leading to a snowball effect.
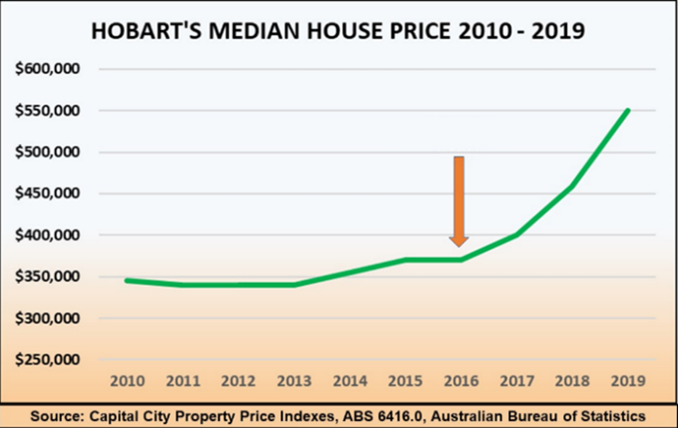
Hobart is one of our prettiest cities, framed by majestic Mount Wellington and the sparkling waters of the Derwent Estuary. A decade ago, it was also the cheapest capital city in Australia to buy property, with a typical three-bedroom house costing around $350,000, half of the then median price in Sydney.
As the graph shows. From 2010 to 2016 Hobart experienced very little price growth giving investors or developers no incentive to buy or build property. Yet the city’s population was quietly growing, generating demand for around 1,000 new dwellings each year. Because of the lack of new housing development, virtually all buyer demand was for established properties.
By mid 2016 a tipping point was reached, as the demand for housing was higher than the number of dwellings for sale.
Hobart’s house prices suddenly boomed with a fifty percent rise occurring in just three years. This led many experts to speculate on what had caused Hobart’s property market to boom so unexpectedly.
The snowball effect is created by a growing shortage of properties
Hobart’s house prices started to rise because the demand for properties had begun to exceed the number for sale.
Constant buyer demand caused the supply to keep falling, creating a snowball effect as prices started to escalate. Hobart was Australia’s best performing capital city housing market for the next three years.
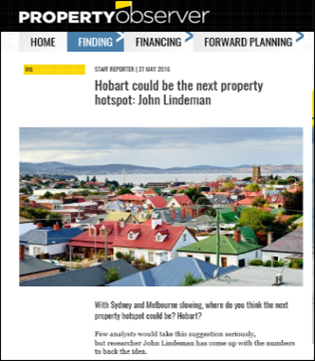
Predicting Hobart’s housing market boom
Back in early 2016 our Housing Market Prediction Solution revealed that the number of properties listed for sale in Hobart was declining, and that potential buyers were beginning to outnumber the supply of properties available for purchase.
The lack of new housing meant that buyers had to compete for established properties. As listings were falling rapidly, it was obvious that the snowball effect was about to occur, and I made my now famous Hobart boom prediction in the property media.
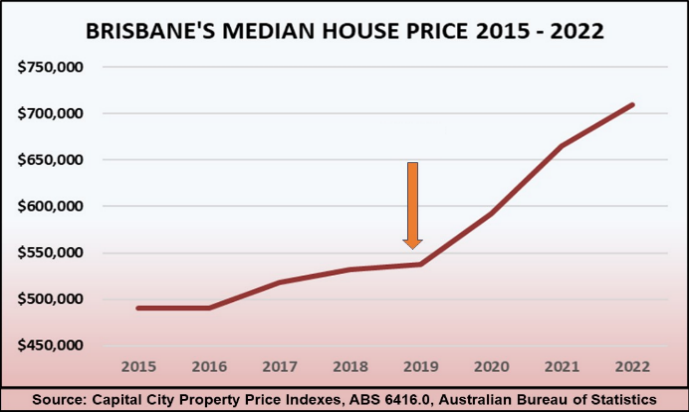
The Brisbane property market boom from 2019 to 2022
Brisbane’s property market has seen house prices more than trebling in the last three years due to the same sequence of events.
Before 2019 the city’s population growth rate of nearly two percent was creating a need for 20,000 new homes each year. But there had been little price growth and Brisbane’s median house price remained below $550,000.
Developers could not compete on price with established homes and the rate of new housing builds slowed down.
The Brisbane property market reached its tipping point in 2019 and over the next three years, Brisbane’s housing prices have boomed, with property values growing by over one third as buyers compete for the stock remaining.
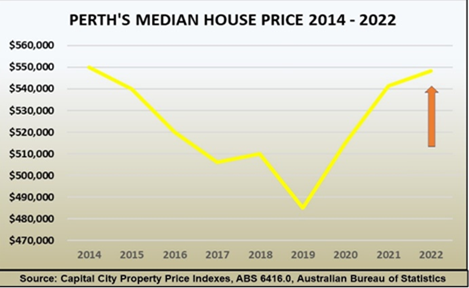
Which city will experience the snowball effect next?
Perth’s population continues to grow and there’s a need for around 15,000 new homes each year. However, Perth’s median house price of $550,000 has only just recently recovered back to where it was a decade ago. This has led to little interest from investors or developers and housing construction numbers have declined in recent years, with developers unable to compete on price with existing dwellings.
Is Perth’s housing market about to experience a similar snowball effect to Hobart and Brisbane? To find out we consulted our Housing Market Prediction Solution.
This shows that the number of listings in Perth has been falling and that buyer demand is now higher than the number of properties for sale on the market.
There is every indication that house prices could start to rise strongly in Perth and based on our studies of the snowball effect, Perth could become Australia’s best performing capital city housing market over the next few years.
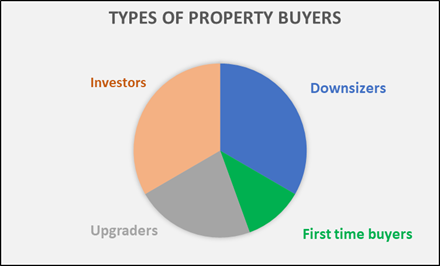
Buyer demand is falling in all our property markets, yet the cause of this hesitancy is not solely due to interest rate rises, but the fear and even panic that rate hikes create about possible housing price falls or even crashes.
This fear of the unknown explains why potential property buyers are holding back, even though most of them either have no need of housing finance or are relatively immune from rate hikes.
The chart shows that thirty per cent of homeowners have no remaining housing debt, and have no need of housing finance when they buy another home.
Another thirty per cent are investors who claim the cost of housing finance interest and can also raise asking rents to recoup the cost of interest rate rises.
Twenty per cent are upgraders who purchased their homes many years ago when rates were much higher than they are now and for whom a rise in interest rates is quite manageable.
The remaining ten percent are first home buyers who need to borrow most of the price of a property. In theory, this segment of the buyer market is the only one that is directly hammered when interest rates rise, because higher rates reduce their buying power.
Why buyer demand has slowed down
Yet buyer demand has fallen in every market and from all types of buyers, because we become scared about what might happen to prices generally. Fear is one of our strongest survival instincts and facing the unknown is one of our biggest fears. This is why potential buyers are holding back, waiting to see if more rate rises are coming, leading to a property market crash. Even though the experts assure us that all is well, our instincts take over, urging us to wait until the dust settles.
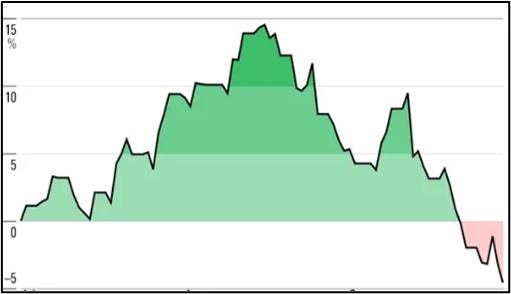
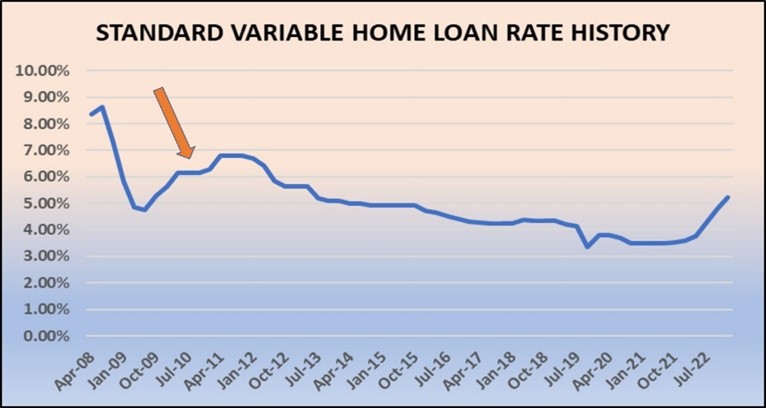
The best way to analyse this phenomenon and the possible outcomes is to look back to the last time that interest rates took a significant upwards hike, which was in 2009-10. (Shown with the red arrow in the graph.) This is because some bank economists are forecasting that a similar rate hike is likely to occur again and that savage falls in property prices will occur as a result.
The rate rise in 2009-10 was the biggest in modern history, but the graph shows that it took the RBA more than a year to implement.
We then had a series of interest rate reductions over the next eight years until the home loan rate was lower than it had been before.
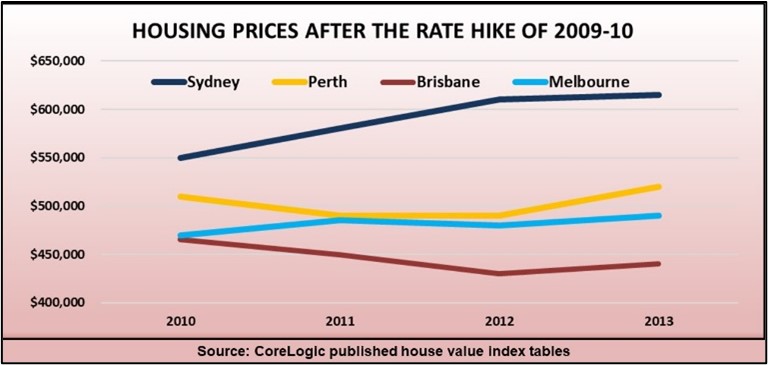
There were no crashes the last time rates rose significantly
What happened to property prices as a result is shown in the graph below. Buyer demand slowed, but while prices fell slightly in cities such as Brisbane and Perth over the next few years, there were no price crashes, and prices kept rising in Sydney and Melbourne although growth was more subdued.
The reason that rate rises don’t lead to property market crashes is that only a small percentage of homeowners are directly impacted, and even fewer are forced to sell because they can’t manage their repayments. The majority simply wait until some certainty returns.
Confidence gradually returned to the property market as interest rates started falling from 2011 onwards and this is exactly what is likely to happen again. In other words, once rates stop rising and it’s obvious that the market is not going to crash, buyer and seller demand will pick up again.
Rising interest rates, strong population growth and a worsening housing shortage are pushing rental demand well ahead of rental vacancies. While the outlook for renters is bleak, with asking rents about to surge strongly in many areas, this also means that property investors seeking positive cashflow properties will be the winners.
There are two reasons for the growing shortage of rentals. The demand for rental properties is rising strongly and at the same time the rate at which new dwellings are being built is falling. Housing construction has been impacted by rising costs and shortages in both materials and labour which have led to a dramatic fall in the rate of new housing development over the last two years.
Australia’s building timber stocks have been nearly wiped out by the east coast megafires of 2019-20 which were unprecedented in their extent and intensity. This has led to a critical shortage of softwoods used for cladding and frames, with rising prices for metal, structural steel, reinforcing, fixings and fencing, plus soaring fuel, freight and electricity costs.
In addition, two years of international border closures have left developers struggling with an acute shortage of qualified construction workers. As cost and time blowouts worsen, more builders are leaving the industry or going to the wall. The net result is that fewer new homes are being constructed and it’s taking up to a year longer than expected to complete them.
Population growth has continued, and rental demand is rising
Even with closed borders and no overseas migrant arrivals for over two years, our population has kept growing. People are still setting up new households and creating more demand for accommodation, especially rentals. Renters are also likely to be renting for longer than they expected, because higher interest rates reduce their buying power.
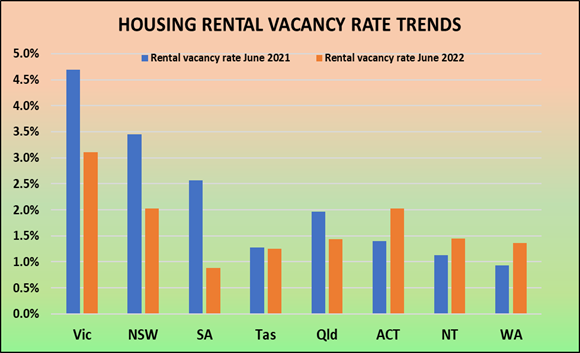
This combination of increasing rental demand and insufficient rental supply has created an acute rental shortage, and it’s getting worse.
The graph compares current rental vacancy rates in each State and Territory to those one year ago. They have been falling in all States except Western Australia.
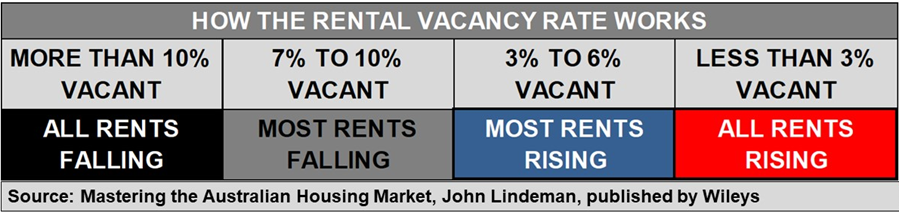
Rental vacancy rates below three percent mean that rents will rise
This is highly significant because our studies have shown that when rental vacancy rates exceed ten percent, all asking rents in an area will be falling, but when they fall below three percent, all asking rents will be rising.
With rental vacancy rates at three percent or less in all States and Territories, asking rents will be rising strongly almost everywhere, but is this situation likely to worsen or improve in future?
Rental demand is likely to rise strongly in future
Rental demand is generated by new households, students, tourist industry workers, permanent renters and construction workers, but the main source of rental demand prior to international border closures were permanent arrivals from overseas. In 2019 Australia’s population increased by 390,000 of which 250,000 (or over sixty-two percent) were migrant arrivals. We can expect their numbers to grow in the next year and beyond as international borders reopen.
Not only can we expect the numbers of overseas arrivals to start rising again, but most of these households must rent on arrival, and remain renters for several years before they are sufficiently well established to buy their first home. Rental demand, especially in the inner urban areas of our major cities is expected to shoot upwards as a result and is highly likely to send asking rents soaring.
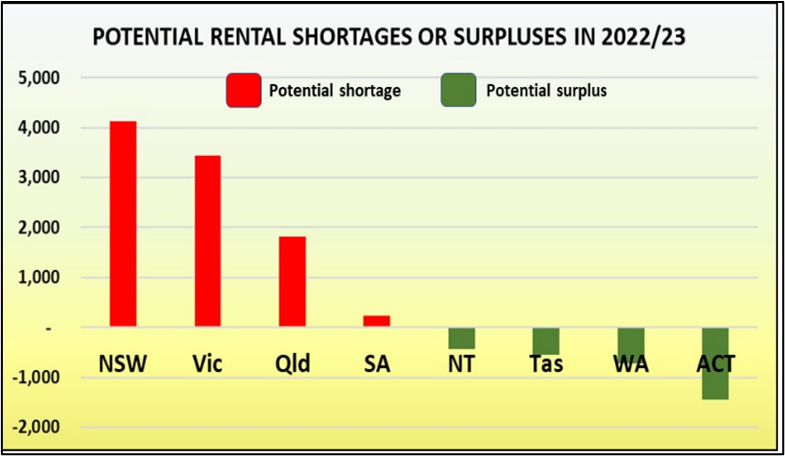
The graph shows the potential rental shortages or surpluses in each State and Territory over the next year.
We have compared the likely availability of rental dwellings to the expected demand for them from new renting households, permanent renters, interstate movers and international arrivals.
Can a massive rental supply crisis be averted or corrected?
There are only two ways that such a shortfall can be prevented or corrected. The first is by direct government action, dramatically reducing the number of permanent arrivals to Australia. This would not only lead to even more labour shortages, but could also result in a wages and salary explosion with worsening inflation.
The second is by a massive increase in the number of new homes being constructed. This would require a direct reversal of the current trend which saw dwelling approvals over the last year fall by nearly twenty-five percent. Such new dwellings would also need to be located in areas with the greatest potential rental demand, which are often not the locations favoured by developers.
As neither of these solutions are likely to occur in the foreseeable future, we are entering a period when investors looking for positive cash flow will be the winners.
The last Census was conducted in August 2021, when our international borders had been closed for over eighteen months, State borders were firmly shut and the southern capital cities were in lockdown.
Much of the data illustrates the abnormalities that these restrictions on movement caused, but the stats also reveal how some people simply avoided them altogether by secretly slipping away to safety.
There have only been a few times when Australian’s have felt sufficiently threatened to make a run for safety, such as during the Second World War. Many Sydney homeowners feared invasion, and some fled over the mountains, returning when the danger was over. The new Census data has revealed that some people did the same thing during the pandemic.
There was a secret slip away to safety
People who were lucky enough to have holiday homes located away from the lockdowns, restrictions on movement and the COVID-19 threat itself were able to quietly relocate to the safety of their holiday homes until the danger had dissipated.
One of the most public of these slip aways was that of former NSW Arts Minister Don Harwin, who was fined $1,000 by police and resigned his portfolio when he was discovered living at his Pearl Beach holiday home in an apparent breach of the coronavirus public health orders.
Holiday homes were used as bolt holes
There are around one million holiday homes around Australia, mostly only occupied during peak holiday seasons, but the last Census, which was conducted in August when Sydney, Melbourne and Canberra were in lockdown, shows that many of these were temporarily occupied during the pandemic as bolt holes.
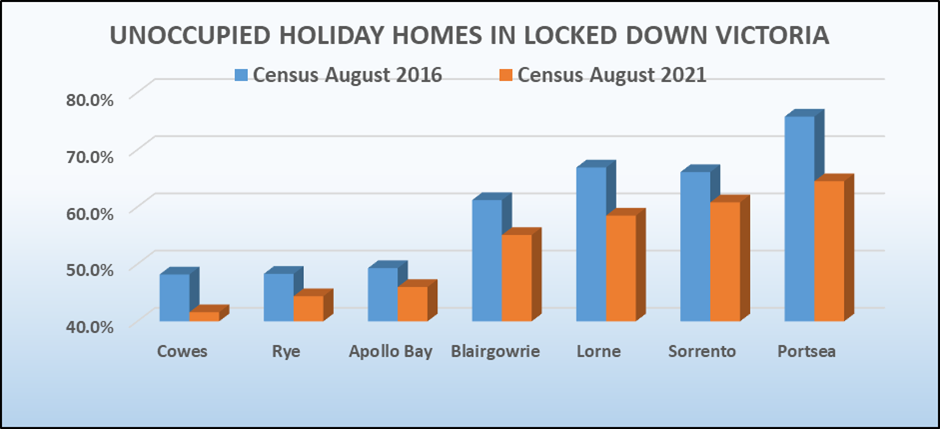
With Melbourne being the most locked down city in the world during the crisis, it’s not surprising that the percentage of empty holiday homes in regional Victoria fell dramatically when the 2016 Census figures are compared to last year’s “pandemic” Census. In other words, the number of holiday homes that were occupied during the Census actually rose, even though they would not normally have been occupied in August, when the Census is conducted.
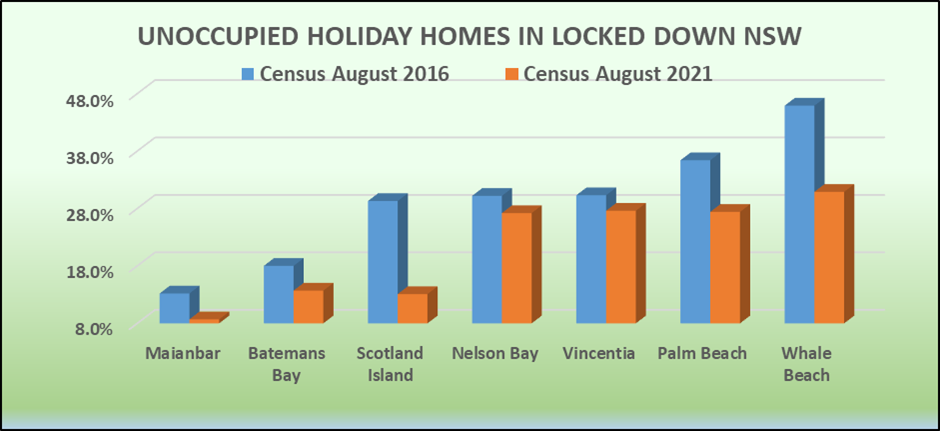
This slip away to safety also occurred in New South Wales with Sydney in lockdown during the 2021 Census. The figures show that the percentage of holiday homes that were occupied during the lockdowns rose when compared to the previous Census.
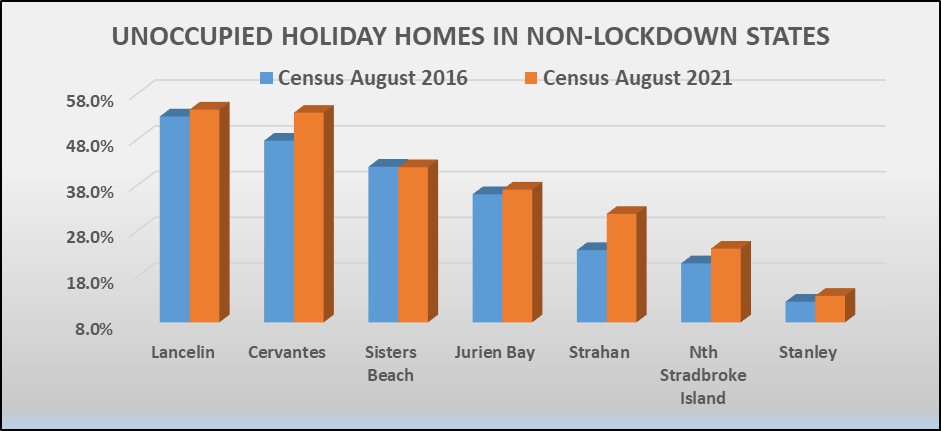
Empty holiday home numbers actually rose in no lockdown states
This flight to safety did not occur in States where there were no lockdowns in force at the time of the 2021 Census, as the data from some of the most popular holiday home locations in Queensland, Western Australia and Tasmania clearly shows.
It seems that many people in Sydney, Melbourne and Canberra slipped away not just to avoid catching the virus, but to get away from lockdowns, while there was no such motivation in Brisbane, Adelaide or Perth, where no lockdowns were in place.
Much of the 2021 Census data was skewed by the pandemic
The slip away to safety highlights the fact that last year’s Census was conducted at a very unusual time in our history. Much of the data collected was not typical, with closed international and State borders, restrictions on movement and lockdowns in place during the Census in many areas.
For example, rental demand in the Melbourne CBD collapsed during the pandemic because of closed borders and lockdowns. The number of unoccupied units trebled from 2016 to 2021 with nearly one third of inner Melbourne apartments being empty during the 2021 Census.
It’s a similar story in student precincts, where the number of students dropped dramatically as they returned home. Kelvin Grove is an inner suburb of Brisbane with several tertiary institutions and a teaching hospital. The number of student group households fell by 25% during the pandemic.
Tourism came to a sudden end in popular holiday locations and the number of workers in tourist related industries such as accommodation, hospitality, restaurants and specialist retail fell. As most of these are usually students and backpackers, rental demand collapsed as well.
While the 2021 Census data will still be extremely useful, this is one Census where the information will need careful checking to see if the data may have been skewed by the impact of restrictions on movement, lockdowns, interstate travel, social distancing and international border closures that were in place at the time. And of course, the stats show us that not all people obeyed the health regulations and simply fled to the safety of their holiday homes until the lockdowns were over.