The mindset of successful investors
Over the last fifteen years I have answered hundreds of questions from property investors at live training events, workshops and bootcamps, but never so many and none so urgent as when markets begin to stagnate, and the future seems uncertain.
Here are the four most pressing questions I’ve received at such times and my answers, which may help you to achieve your own mindset for investment success.
How important is timing my purchase vs time in market?
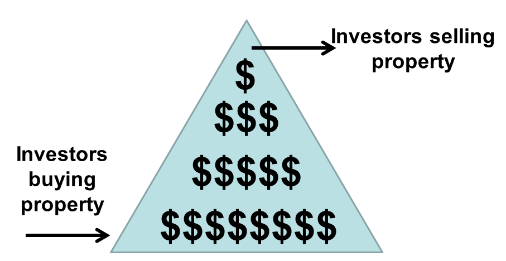
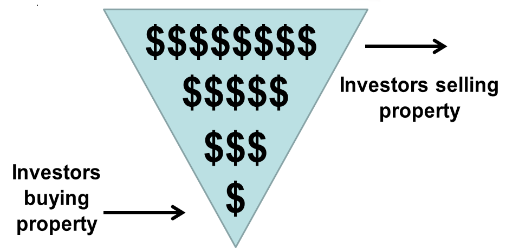
Baron Rothschild once famously said, Buy when there’s blood in the streets. What he meant is that the best time to buy is when everyone else is trying to sell.
The issue with this is that we don’t know that the bottom has been reached until growth has returned, so buying at the apparent bottom could only mean further falls are coming.
To this famous quote I would add: Buy when there’s blood in the streets, but not if it’s yours.

In other words, it’s never a good time to take risks with your investments, especially with property which is easily the biggest investment most of us will ever make. The best time to buy is when we are confident that good growth is about to return, or has already started.
How can I take a long term perspective, when the news is becoming negative?
Over the last decade, our news sources have changed dramatically. We now rely on digitally delivered media for the news that we traditionally obtained from magazines, periodicals and daily newspapers.
As a direct result, the use by or expiry date of news stories has shrunk from weeks to hours and even less with grabs and headlines only catching our eye for seconds.
Our news sources focus on immediate and imminent issues, on breaking news rather than in depth analysis. Don’t expect such news sources to deliver any insights into property investment, but rely on proven and trusted providers of property market information to give you their long term perspectives.
How long should I hold a property to see great results?
There is no one answer to this question, because every suburb and each property is different, offering a mix of risk, volatility, cash flow and growth potential. The period of time you need to hold also depends on your desired outcomes, which could be quick market driven growth for a renovation or small development, consistent cash flow and growth for a SMSF investment, or long term buy and hold security.

In general, the areas and types of property which offer speedy price growth also carry the greatest risk of price falls, because they tend to have large numbers of renters and investors.
Renters don’t own the properties they live in, so they tend to move often, while investors don’t live in the properties they own, so they can buy or sell more easily when conditions change.
So, rather than being a matter of time, it’s a matter of choosing the areas and types of property which have the best potential to deliver the results you want.
How can I get over the disease of analysis paralysis?
It’s no wonder that investors often end up confused, with so much information and so many contradictory forecasts to choose from.
Over the years I have seen an incredible array of property related stats, housing data and economic information being used by different theorists and strategists at various times to make their housing market predictions.
They have relied on finance data, population trends, unemployment stats, housing approvals, affordability, stock on market, vendor discounting, time on market, auction clearance rates, rental yields, gentrification, property clocks, past performance, market cycles, market tightness, on-line search trends, prices, sales, listings and many more to generate their forecasts.
The only thing missing from this list is probably the study of tea leaves, or maybe tarot card readings. The point is that there is not just so much data available, there is too much data.
The easiest way to get over analysis paralysis is to rely only on information provided by recognised analysts or experts with proven published records of past success, and who use statistical methodologies which have stood the test of time and delivered a consistently high rate of accuracy.