Posted on

The elephant in the property market

The elephant in the property market

John Lindeman reveals an elephant that’s about to make its presence felt in the property market and he explains why it’s a huge potential game changer.

It won’t be deterred by rising unemployment, housing finance restrictions, buyer confidence or economic downturns.

It has the power to radically alter housing prices and rents, and it’s about to be unleashed on our property markets. What is this elephant in the property market and where will it reveal itself?

The elephant is the massive movement of people from one State or Territory to another that will result in large changes to our property markets.

The biggest changes to property markets are made when people move

People change housing demand and supply when they move, because we all need a place to live. When enough people move, they can dramatically alter housing prices and rents in the process.

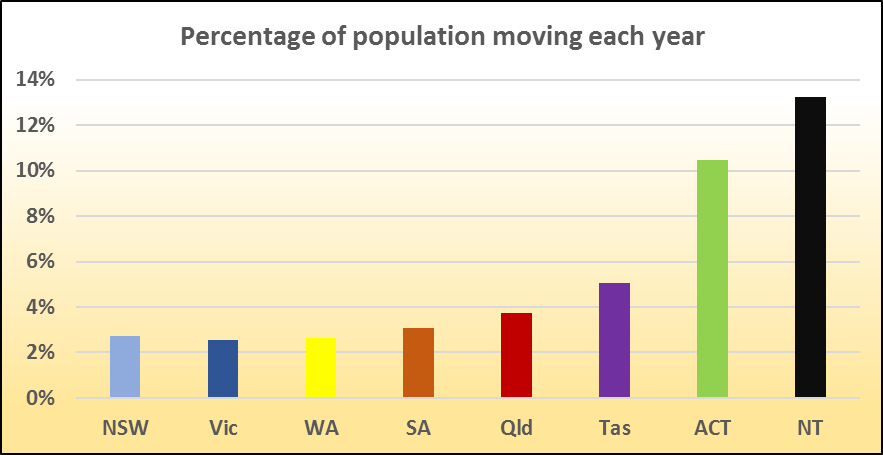
Before our internal borders were closed, around three percent of our population moved from one State or Territory to another each year. Right now, hundreds of thousands of people are waiting for the borders to reopen so that they can do the same. 

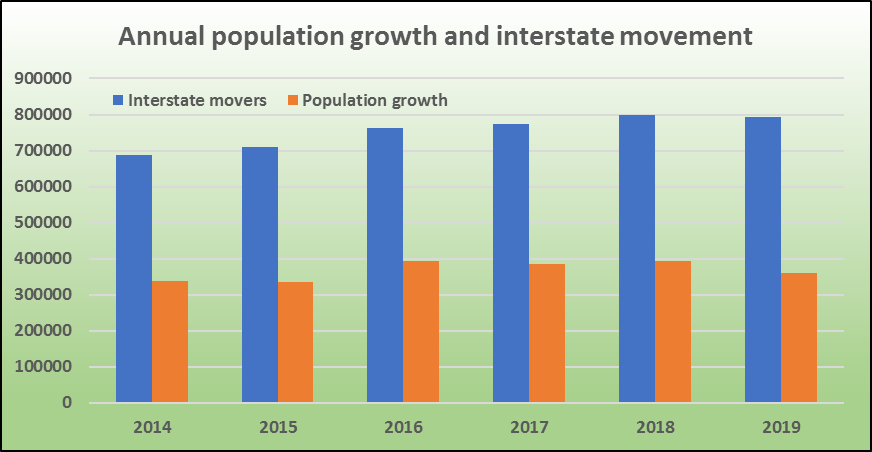
As this graph shows, the numbers of people relocating within Australia from one State to another each year has been more than double our total population growth, leading to far more significant changes in housing markets than growth causes.   

This graph clearly demonstrates that before the pandemic there were twice as many people moving as there were new residents arriving or being born here, but there’s much more to it – these relocators pack a double whammy. Not only does every moving household increase demand by needing a new home where they move to, they leave an empty one behind, increasing housing supply where they move from.

That’s hundreds of thousands of properties changing tenants or owners each year as people move from one State to another. It’s like a huge elephant making its presence felt wherever it decides to move around.

With such massive numbers of people moving, why is this phenomenon going unnoticed? It’s partly because the current border closures have stopped interstate movers in their tracks.

The elephant is hidden from our view

Yet, even when our State borders reopen, the potential effect of these relocations is still likely to go unnoticed. This is because many statisticians and economists quote and rely on net interstate migration numbers, not the total number arriving or leaving.

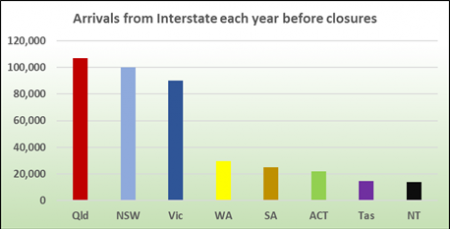
Net interstate migration numbers leave us with a distorted view of what’s actually been going on. For example Canberra’s net interstate migration last year was zero, but what this hides is that 22,000 residents left the ACT, and another 22,000 new residents arrived.

The graph shows that around ten percent of Canberra’s population move in or out of the ACT annually.

The “zero” net interstate migration figure for Canberra completely hides the highly significant fact that so many people do move, and the effect that they have on the city’s housing market.

Net interstate migration hides changes in housing needs and preferences

Why is this important? Because the people arriving very often have different housing needs from those leaving. Most of Canberra’s arrivals are young professionals seeking work in the public service and creating demand for unit rentals, while many of those leaving are older residents retiring at the end of their careers and selling fully owned family houses.

In fact, many of the otherwise unexplainable ways that housing markets perform become crystal clear when total interstate migration figures are taken into account.

What will happen when the State borders re-open?

Interstate migration has come to a temporary halt with the State borders closed, but is sure to start again when they reopen. There will also be a huge backlog of people who have been anxiously waiting to move, and a large number who have simply decided that it’s time to relocate for other reasons.

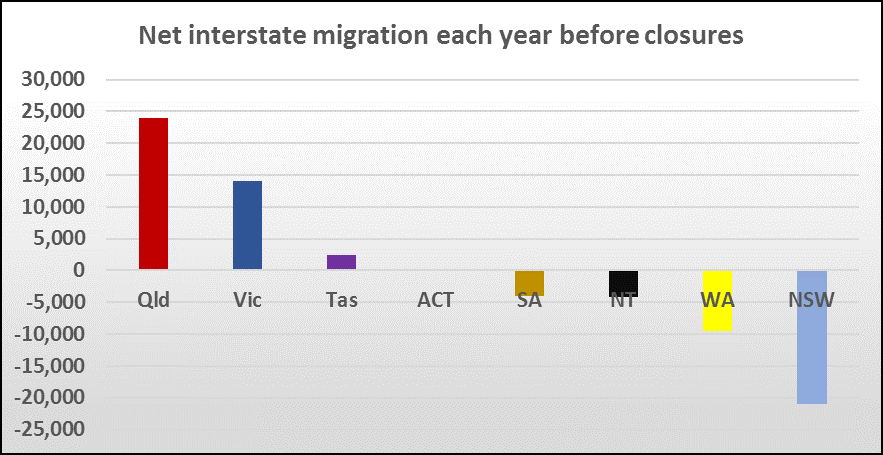
Looking at net interstate numbers doesn’t reveal the total numbers of people moving, but it does show the net effect on State and Territory populations.

The graph demonstrates that last year’s interstate migration winners were Queensland and Victoria, while the losers were South Australia, the Northern Territory, Western Australia and New South Wales.

The critical fact is that there are many different types of people moving, and their housing needs are varied. Last year, younger people left Perth, Adelaide and Tasmania in search of employment, education and lifestyle opportunities.

Young couples and families left Sydney in search of more affordable housing in Melbourne and Brisbane, while older people moved from Sydney and Melbourne to downsize in retirement havens and coastal resorts in Tasmania and Queensland.

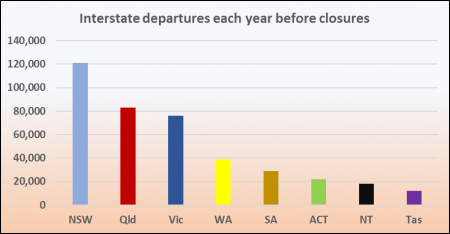
Most of this movement is hidden from view when we use the net interstate migration figures. For example, the following graphs show the total number of people moving in or out of each State and Territory last year.

Arrivals
Departures

You can see that 120,000 people left New South Wales last year for other States, but another 100,000 arrived from those areas, leaving the State with a net loss of 20,000 to other States. The point is that the many of the people who left were older people looking to downsize or young families wanting to buy their first home in a more affordable city, while many of the arrivals were young renters from other cities.

The total effect of these moves is hidden by the relatively small net interstate migration outcome, but what is far more important is what will happen when the State borders reopen.

The big property market winners and losers will be different

Large numbers of people will start to move again when the borders are open, and there are likely to be even more of them than before, because of the backlog that has built up this year. Their destinations will also be different, because some cities have become more attractive while others have been tarnished with a COVID-19 stigma that may take some time to dissipate.

More opportunity seekers leaving the western and central States and Territories will be attracted to South-east Queensland, and Brisbane in particular is about to receive large numbers of young renters when the borders reopen. Watch for a dramatic rise in rental demand in areas they move to, especially inner urban unit markets.  

People

Young couples and families will again leave Sydney in search of more affordable housing, and are likely to head for first home buyer areas in Brisbane and the Sunshine Coast. This means that prices in the newer outer suburban areas of these cities are likely to rise, especially first home buyer locations, which is good news for Brisbane property investors, who have been waiting a long time for growth to return.

Potential retirees will also be on the move again from southern cities and both Tasmania and South-east Queensland will be the beneficiaries, with demand rising in coastal towns and retiree destinations, especially for low maintenance, easy access and secure dwellings which are retiree ready.

Retirees

Get in before the booms start again

This is not to say that all relocators will choose the same destinations, and other housing markets will benefit from increased renter and buyer demand, but by investing in areas that are likely benefit most from interstate migration we will get a strong head start on the price growth and rental demand to follow.

This is because these interstate movements will begin well before our international borders reopen.

The areas that will benefit are likely to be the same as those favoured by overseas arrivals, when they start arriving later next year, pushing them into strong growth.

Migrants

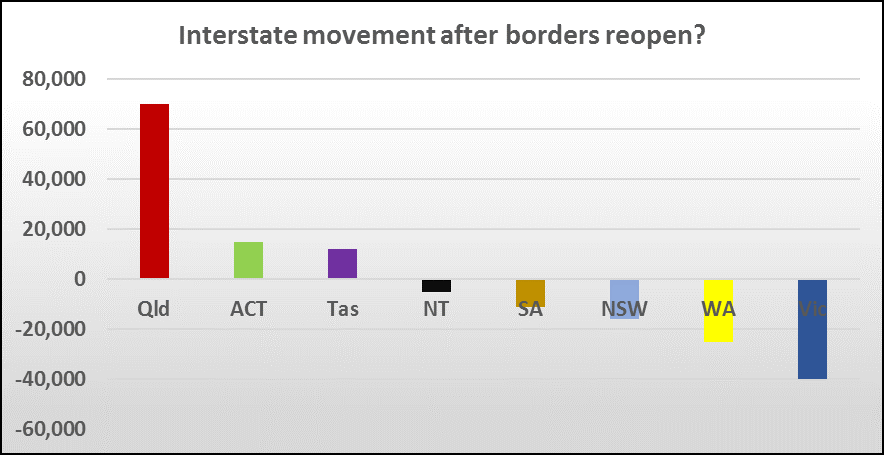
This graph provides a picture of how net interstate migrations could pan out once borders are open again, with Queensland and in particular Brisbane and the Sunshine Coast being the big winners. 

Sources:
CoreLogic publishing housing price data
Australian Demographic Statistics, ABS, 3101.0

Posted on

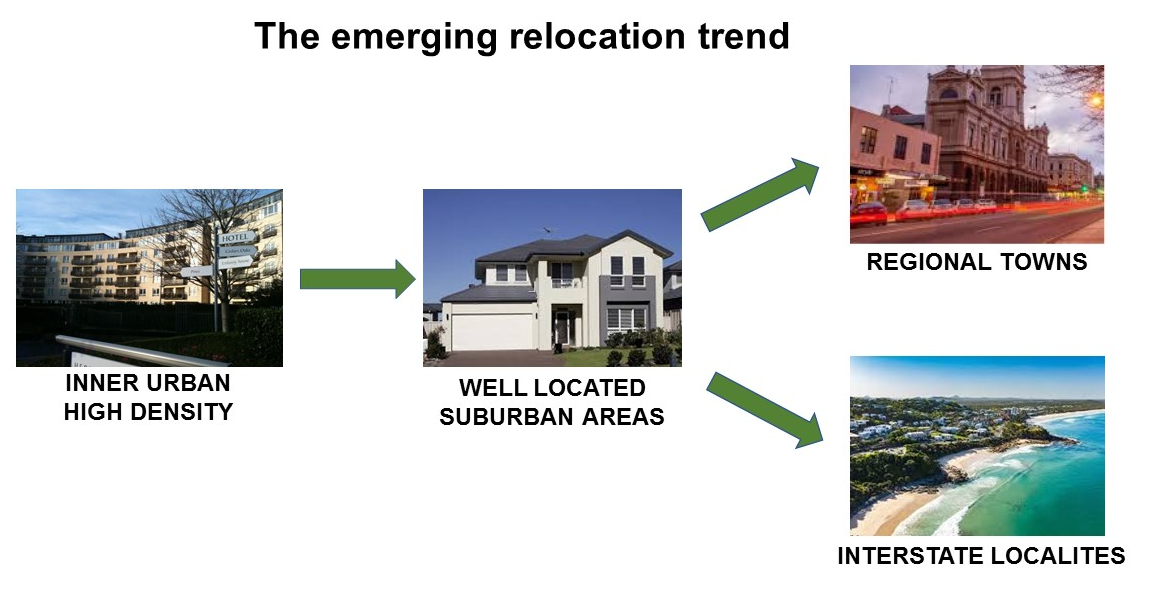
The emerging relocation trend

The emerging relocation trend

Many people are becoming increasingly dismayed and disillusioned with the impact that the pandemic is having on their personal, social and financial circumstances.

While some are looking for any opportunities that the new normal is presenting, others are taking action – they’re moving.

More and more people are making plans to move as soon as they can. While some of them may rethink their plans when things are relatively back to normal, others will definitely relocate.

The latest property data indicates that several relocation trends are already emerging, with professionals upgrading, retirees downsizing, couples and families relocating. This is not something new, as people have always moved in search of better opportunities. 

We have experienced such relocation trends before

Most of us have parents or other forebears who were born overseas. Although some people have come here to escape persecution and discrimination many arrived in the hope of finding better opportunities for themselves and their children. 

In fact, before our borders were closed, over sixty percent of our new residents regularly came from other countries.  


Ship

But while our relocations are not novel, what is currently driving people to make such moves certainly is, and this is setting in train a new wave of moves which are likely to grow in number as the economic downturn worsens next year.

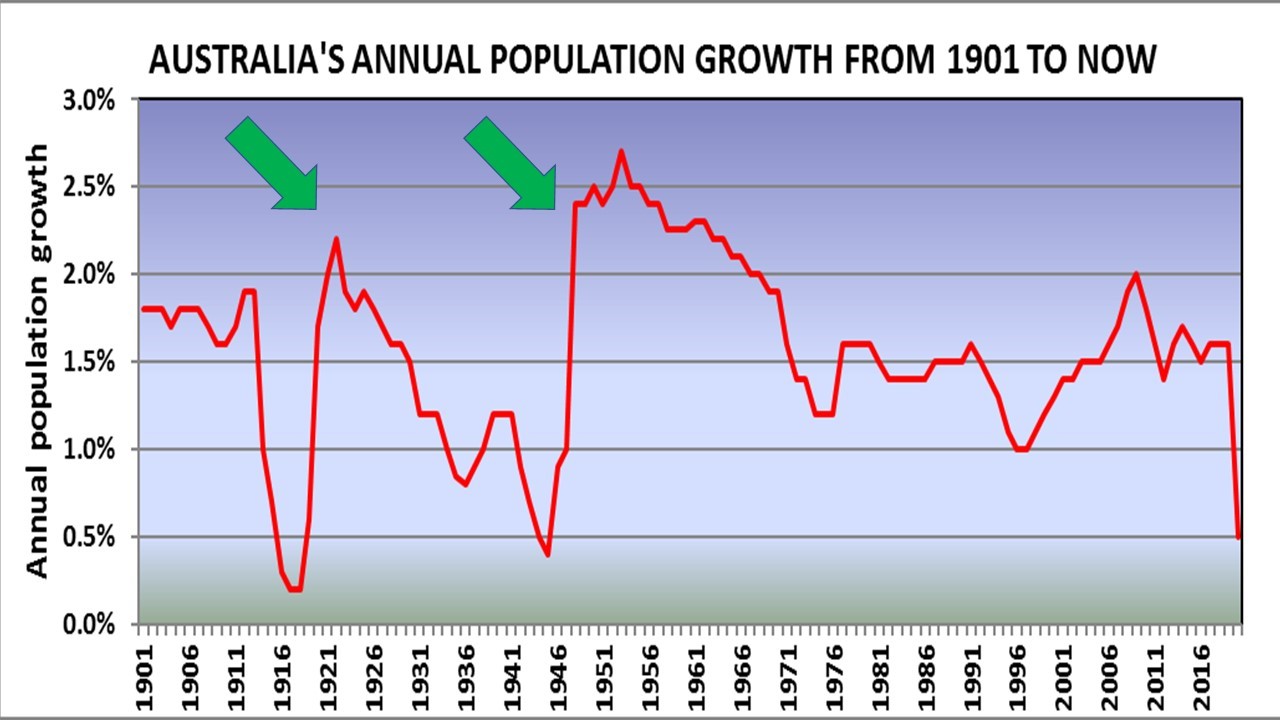
Perhaps the closest parallel we can find to this situation is what took place during the Great Depression, when our population trends underwent two massive changes.

  1. In response to the economic crisis, our borders were closed to new overseas arrivals. As most of these migrants preferred living in our biggest cities, housing demand in Sydney and Melbourne fell.
  2. Many existing residents moved or were driven from our major cities to regional and rural areas, seeking work, affordable housing and an escape from depressed urban environments. This caused a rise in housing demand in those areas.

The drift to regional and rural areas was driven by massive changes in the economy and social order which the Great Depression created. Unemployment numbers rapidly rose during the early 1930’s but even those with jobs had their wages cut. Many lost their homes and found it impossible to make ends meet. It was also a time of social unrest, especially in the big cities where right and left extremists held protest rallies and urged people to reject a system which had failed them.

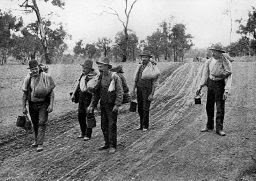
Australia’s rural areas offered people an opportunity to escape from the turmoil. Single men took to the road, becoming swaggies who tramped from town to town seeking whatever work was available.

Needy families found cheap food and accommodation in country towns, growing their own food and making do with whatever nature could provide.

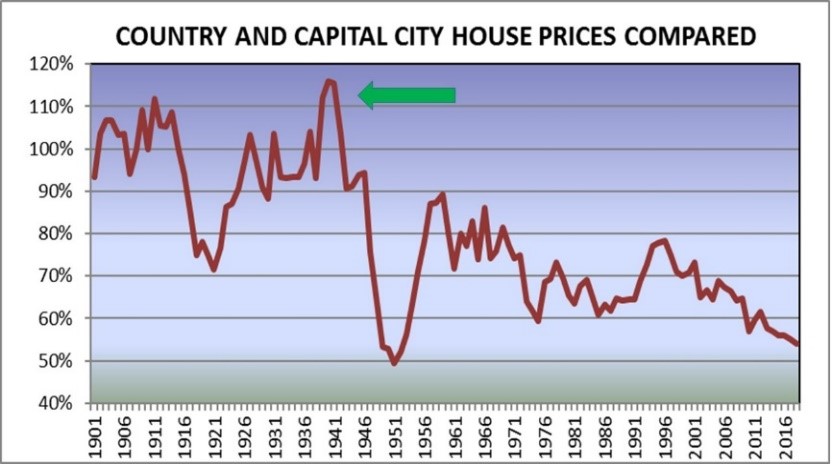
The graph shows how the average price of a country house compared to a similar city house has changed over time. During years of large scale immigration and economic prosperity, city house prices have risen more than those in country areas. At one of these periods (during the early fifties), the value of a country house was only half that of a comparable city dwelling.

The graph shows that this trend was dramatically reversed during the Great Depression, when city house prices fell more in value than country ones, some of which actually rose.

By 1940, (green arrow) the price of an average country house was fifteen per cent more than that of a similar city house, something which has never occurred before or since.

Could this happen again? All it would need is the same two coinciding population trends, which are a massive reduction in overseas arrivals and a significant shift away from city living to regional and rural areas. We are now witnessing the emergence of both of these trends. 

This is the emergence of a new relocation trend

Not only have the numbers of overseas tourist, student and migrant arrivals collapsed, leaving our inner urban rental markets in a state of disarray, but many existing residents are deserting them because they were never designed to cope with the new social distancing requirements and the attractions of urban living have dissipated.

Some inner urban locations could even be in danger of becoming virtual tomb towns. Not only has their attractiveness for future tourists, students and recent arrivals diminished, but the numbers of such new arrivals are likely to be far lower in the foreseeable future.   

This trend will continue and strengthen as the economic impact of the pandemic develops over coming months.

Such a dramatic shift in housing demand could even lead to housing booms in locations less unaffected by the pandemic and its social and economic fallout, where people will hope to discover opportunities for exercise, entertainment, employment and a better lifestyle, free from the threat of restrictions on movement, assembly and travel.

While the causes of our current situation are very different from those that led to the Great Depression, the social effects could turn out to be very similar. In coming months and years, we may witness a complete reversal of the trend to live in densely populated urban areas.

As increasing numbers of people discover the benefits and attractions of living in clean, green regional areas and in States that have been less impacted by the pandemic we are likely to see housing prices in the most sought after regional and rural areas rising strongly in comparison to those of the big cities, at least for the next few years.

Posted on

The property investment puzzle solved

The property investment puzzle solved

In the current air of uncertainty, we know that some localities should be avoided, while most others will still deliver rental income and price growth over time. The best results, however, will only be secured by investors who know which suburbs will deliver the strongest cash flow or highest imminent growth.

The issue for investors is that the housing market is like a huge jigsaw puzzle, with more than ten million properties spread over 15,000 suburbs. Although it may seem impossible, with so many properties and suburbs to choose from, success can be achieved by sorting all the suburbs in Australia into groups with similar risks, opportunities and potential.

I have done this for you by creating four groups of suburbs called Cash Cows, Shooting Stars, Sleepers and Long Shots. To estimate the likely performance of any suburb, all you need to know is which group it belongs to.

CASH COWS, SHOOTING STARS, SLEEPERS AND LONG SHOTS

Each group contains all those suburbs which have certain characteristics in common, such as their locations, buy price ranges and types of properties, types of renters and potential buyers.

This not only makes them easy to find, but also reveals the likely results you will receive from each of them as an investor.

This knowledge gives you a much better chance of buying in an area with the best potential to meet your goals. So, what are the opportunities and risks of the suburbs in each of the groups?

SLEEPERS OFFER LOW RISK, BUT AVERAGE PERFORMANCE

Most of our 15,000 suburbs are located in established areas of our capital cities and regional towns. They are the sleepers, where property pices and rents move in tune with the overall ebb and flow of the market. Because there are so many sleepers, they actually “make the market” and it is their rent, price and yield performance that generates the city and regional median house and unit data we read about.

This means that if you invest in a typical property in an established city suburb, you can expect to obtain average performance over time – no better, and no worse.

CASH COWS OFFER HIGH RENTAL YIELD WITH SECURITY

Cash cow suburbs are the holy grail of investors who look for positive cash flow because they provide high rental yield driven by genuine rent demand. Due to recent pandemic induced lockdowns and border closures, however, some of these locations can be highly risky, especially if they rely on rent demand from migrant arrivals, overseas tourists or international students.

You will still find them in areas with large numbers of permanent renters, such as the older, well established but ungentrified ex Housing Commission precincts and also rural towns which have pools of permanent renters whose local ties are too strong to encourage them to leave.

Holiday destinations can provide high rental yields, but the demand is often seasonal, peaking during the summer holiday season, or during the winter months in tropical locations and alpine resort towns. .

Some cash flow locations experience a temporary rise in rental demand when mines are constructed or further developed and during transport infrastructure projects including the building or expansion of railway lines, ports or highways. These rental booms are most common in remote and regional areas where the workers must rent in nearby towns until the project is complete, when the renters leave and the high cash flow often ends.

LONG SHOTS PROMISE HIGH RETURNS BUT WITH HIGH RISKS

The hope of buying in a town or suburb just before it bursts into spectacular growth is something that appeals to us all. It would be like winning the property lottery and indeed the similarity is striking, because only very few people who invest in long shots ever hit the jackpot.

Most of these investments are based on pure speculation about an imminent housing boom, rather than actual evidence. They start with attention grabbing news headlines or trending social media posts about a huge new mining venture, port expansion, railway line or other intrastructure project that has everyone buzzing with excitement, and the fear of missing out. 

Because so many of these big ticket projects are delayed, altered, abandoned or don’t even start, the initial boom often ends along with the enthusiasm of speculators who rushed in to buy properties. Their disappointment turns to panic as property prices crash and no one wants to buy. Long shots are strictly for those who can bear the risk of recurring losses in the hope of an occasional huge payoff.

SHOOTING STARS PROVIDE BOTH HIGH RENT AND PRICE GROWTH

Waiting quietly amongst the sleepers, cash cows and long shots are the shooting stars, those suburbs with the potential for buyer or renter demand to rise dramatically, generating high price and rent growth in the process.

Sleeper suburbs can turn into shooting stars with a sudden rise in first home buyers, upgraders, relocators or downsizing retirees. Cash cows boom if a dramatic lift in rental demand sends sends rental yields upwards and investors start competing to buy properties.

Long shots transform into shooting stars when work on a new mine or infrastructure project actually begins and rental demand from construction workers sends rents shooting upwards. Prices often also rise as investors rush in to buy properties.

On completion, some projects such as highway duplications and new railways can cause a second and more sustained boom in buyer demand and prices as nearby areas become safer, easier and quicker to access.

The secret to success is to locate areas where a sudden rise in buyer or renter demand is imminent, and then buying the right type of property just before the growth kicks in.

Posted on

Canberra set to boom in the gloom

Canberra set to boom in the gloom

Which city is about to boom? According to property market expert, John Lindeman the answer is Canberra, where massive economic incentive and business recovery programs will be administered as the government works to rebuild our economy.

Recent data shows that Canberra’s housing demand is rising strongly and the city is set to experience a property market boom.

  • Canberra is experiencing the second highest population growth rate of all our capital cities at 2.2% per annum (behind only Melbourne).
  • Canberra’s population growth rate will grow further while that of other capital cities declines due to the collapse of overseas migrant, student and tourist arrival numbers.
  • Canberra has the highest rental yields of capital city markets, attracting investors who seek positive cash flow from day one.
  • Housing finance figures for May 2020 show that it was the only State or Territory with an increase in the amount of housing finance.

While Canberra has the third highest median house price in Australia, prices are likely to grow further over the next few years, even as other housing markets stagnate or go into decline.

The reason why Canberra’s housing market thrives when others barely survive is because many of the city’s 30,000 businesses benefit directly from federal government procurement decisions and programs, which often increase during economic downturns.

Government administration produces nearly one third of the Australian Capital Territory’s economic output and indirectly accounts for over forty per cent of its workforce, so whenever the number of public servants in Canberra increases, housing demand grows there as well.

The total number of Canberra based public servants is now at a record high, but it is highly likely to grow even more. There will be a massive rise in the number of public servants needed to administer the government’s economy rebuilding programs which will be launched later this year to get the economy moving again.

Because most of the new public servants will be on short term contracts, they may only initially intend to reside in the national capital for a few years.

This means that they will prefer to rent well located, well-appointed low maintenance dwellings rather than buy a property, and they will also prefer to live in units because of Canberra’s bracing climate.

Canberra’s most popular suburbs for unit renters are located in the entertainment precincts of Civic, Braddon and NewActon, offering a popular mix of shopping, cafes, fine dining and exciting nightlife experiences.

Rental demand is also likely to be concentrated along the recently completed Canberra Metro light rail route, from Gungahlin to the city centre as shown on the map. 

These suburbs offer positive cash flow investment opportunities from day one, with the highest genuine rental yields available in any of our capital city unit markets.

Such high yields will attract investors seeking cash flow, and with the competition from investors likely to exceed the supply of available units, prices are likely to rise as well.

Many of Canberra’s new residents will decide to stay and make Canberra their permanent home, and as they gradually move out of rental accommodation they become first home owners.

This means that the demand for housing in Canberra continuously shifts from rentals to home buyers, so if the number of renters keeps rising as forecast, then home buyer demand will rise as well. As a result, Canberra could soon become the city with Australia’s highest house and unit prices.

Sources

Australian Public Service Commission Annual Reports
House Price Index – Eight Capital Cities 6416.0 Released quarterly
Housing Finance Australia 5609.0 Released monthly
Australian Demographic Statistics 3101.0 Released quarterly

Image Attributes

Parliament House at night by Social Estate via Unsplash
Canberra light rail by Bidgee via Wikipedia

Posted on

Why markets boom quickly but slide slowly

Why markets boom quickly but slide slowly

As each new set of property data is released, it becomes more obvious that some housing markets will be in for a rough ride. John Lindeman explains why property markets slide backwards slowly.

Many experts fail to grasp the reasons why property prices rise quickly during booms but slide backwards slowly during downturns.

Sales increase quickly when markets are hot, and prices shoot up because properties are snapped up as soon as they come on the market.

There are very few properties listed for sale, being outnumbered by large numbers of bidders who compete with each other to purchase, and as long as buyer demand remains high, a boom results.

When buyer demand falls, however, potential sellers dig in their heels and begin a waiting game, hoping that a buyer will turn up. The first signs of a slowdown in buyer activity are therefore not declines in sale prices, but a growth in the number of properties listed for sale and an increase in the time it takes to sell them.

Potential sellers tend to hang on and hope

When vendors still find it difficult to sell their properties, they may decide to change agents, increase their advertising budget, or even take their properties off the market altogether and wait until things improve.

Because no one wants to take a loss, or accept a lower sale price than they expected, only vendors who want to sell will reduce their asking prices when all else has failed and it is obvious that the market has slowed.

As asking prices slowly fall and the numbers of listings keep rising, sale prices start to decrease. Only vendors who really must sell will keep trying to find a buyer, and so the process repeats until finally a buyer is found. Such downward slides in sale prices can take a year or longer to play out.

But, when the bottom of the market has been reached, it may then take years before buyers want, or are able, to return to the market in sufficient numbers to kickstart the market back into growth once again.

Property prices slide slowly and then take years to recover

Here are some examples from history showing how this slow slide took place during the Great Depression, the sixties Credit Squeeze and the Global Financial Crisis.

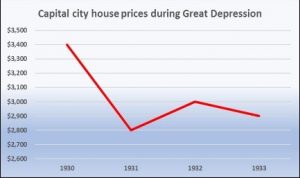
The Great Depression started in 1930, marked by rapidly rising unemployment, falling incomes and bank failures. As the graph shows, house prices crashed by eighteen per cent over twelve months.   

The property market then stagnated for several years, not fully recovering until after the Second World War, well over a decade later.

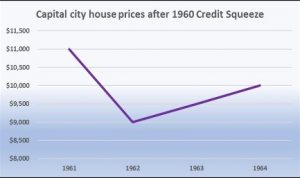
The 1960 Credit Squeeze was initiated by the Menzies federal government, concerned with the huge rise in hire purchase and housing finance debt.

It was short and sharp, but sent shock waves through the housing market for years after. Prices fell for one year after the squeeze, but did not recover for the next four years.

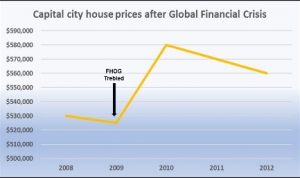
The Global Financial Crisis led to a slide in house prices during 2009 amid fears of a total housing market crash.

With its housing stimulus package, the Rudd government trebled the First Home Owner Grant. This lifted house prices by almost exactly the amount of the grant, after which prices fell once again for the next three years.

Demand side incentives only push up prices – temporarily

The Rudd First Home Owner Grant initiative demonstrates the total ineffectiveness of demand side buyer incentives such as buyer or owner grants and stamp duty concessions because all they do is increase the capacity of property buyers to spend more and push up prices in the process.

You might argue, as many politicians do, that if such concessions, grants and initiatives are limited to new properties, they will generate more housing supply. While it is true that more buyers will then be able to purchase new properties,the benefit is quickly eroded by rising prices, while existing buyer demand shifts away from new homes to existing homes, because they become comparatively more affordable.

Even worse, as pre-existing market conditions return, prices for new homes slide again and many first home buyers may find themselves worse off than before.

Posted on

What’s wrong with predictions

What's wrong with predictions

Whenever the unexpected happens, it seems that everyone is keen to predict possible outcomes for our property markets. John Lindeman reveals which forecasts are useful and which to ignore.

As we strive to unravel ourselves from the COVID-19 crisis and the uncertainty it has caused, property market predictions keep coming, ranging from dire warnings of imminent collapse to assurances that the next boom is on its way.

Such property forecasts may be exciting, interesting, or even scary, but they are seldom of any real value to investors, and that’s not just because they often turn out to be wrong!

Predictions often combine different types of property together

Many predictions make sweeping generalisations by lumping together different types of properties as if they always perform the same way, but the potential performance of different types of housing in the same suburb often varies, because they appeal to the many different types of buyers and renters.

For example, units and apartment markets respond to changes in renter demand, as from sixty to eighty per cent of them are investor owned. On the other hand, eighty per cent of houses and townhouses are purchased as homes, so their markets respond to changes in first buyer, upgrader and downsizer buyer demand.

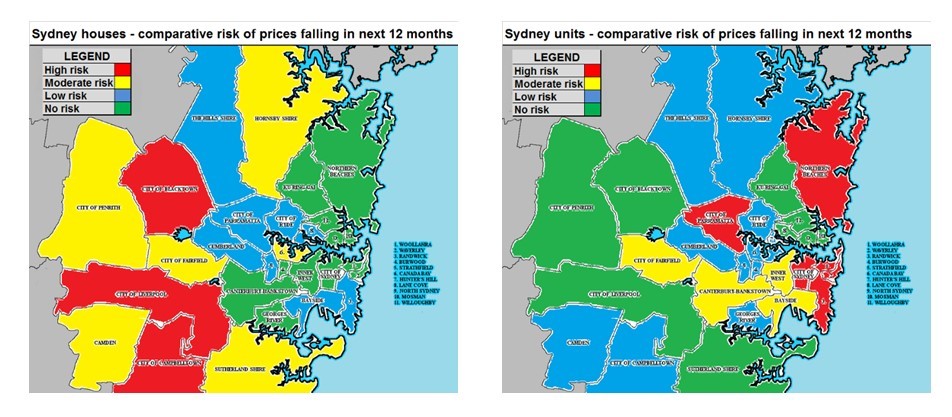
Units and houses can perform very differently, as these two heat maps show:

These heat maps (produced by our patented Housing Market Prediction Solution) forecast the comparative risk of price falls occurring in Sydney council locations for houses and units over the next twelve months.

They reveal that Sydney’s coastal unit markets are at high risk of price falls, while houses in the same locations tend to be at low risk of decreasing prices. At the same time, the outer western suburbs of Sydney have a high risk of house price falls, while unit markets in the same areas are at low risk.

This tells us that Sydney units are likely to perform very differently from Sydney houses in the same areas over the next year. Yet, much of the media provides “property price” predictions, “housing market” forecasts, “home value” indexes or “real estate market” estimates which lump all the houses, townhouses, villas and units together. They show the average performance of them all combined, which is of little practical use and could even be misleading.

Many predictions are for huge markets such as capital cities

Another issue with many property market predictions is that they combine all the suburbs in one city or State together to make a catch all forecast such as “Perth’s housing market expected to crash” or “Brisbane property prices set to boom”, such as this recent example:

We can’t really use these predictions, even if they turn out to be right, because we only buy one property in a suburb, not an entire city. Suburbs in any city are very likely to perform differently from each other and some may boom even as others bust.

For example, if you look again at the two heat maps above, you will notice that there are roughly the same number of areas at high risk as there are those with no risk at all, so by averaging all the areas, we would end up with a moderate risk or low risk prediction for all of Sydney. This may be still be interesting, but is of no practical use to property buyers at all.

Some property market predictions are not meant to be reliable

For any prediction to be of possible value, you need to be able to trust the person making it.

This is because many so-called experts have a vested interest in the outcome of their predictions which has nothing to do with the accuracy of their forecast.  

They will talk up a market purely to encourage you to buy a property from which they will obtain a finder’s fee, commission, kick back, knock on or other financial reward.

We often hear and see such predictions made by project marketers and sellers’ agents who may promote a property market purely because it is in their interests to motivate us to purchase. That’s why property market predictions need to be as accurate as possible, because they could lead us into making decisions involving huge amounts of money and many years of financial commitment.

Make sure that any forecasts you intend to rely on are provided by recognised analysts and experts who have a proven published record of past success. Ensure that they are not based on hidden agendas, gut feel or intuition, but on proven statistical methodologies which have delivered a consistently high rate of accuracy

There’s no “one size fits all” for property market predictions

As you can see from this image, property investment offers us many different strategies to choose from depending on our finances, skills, time and most of all, what results we want to obtain.

We need strong cash flow if we want to obtain income from rent, or seek high imminent growth during our hold period for flipping or cosmetic renovations. We want medium term growth during structural renovations or developments and look for long-term growth with our buy and hold purchases.

In short, there’s no “one size fits all” when it comes to property predictions, especially in these uncertain times.

A high cash flow forecast is of no use in a suburb where we plan to do a buy-reno-sell strategy because we won’t be renting the property out, while a prediction of high market driven growth during our hold period would be very welcome.

In summary, the only predictions that you can benefit from will be produced with accurate methodologies delivered by reputable analysts. They should identify those suburbs that have the best potential to deliver success for your own preferred investment strategies and they should be relevant to our current economic situation.

Posted on

How spruikers use stats that suit them

How spruikers misuse past performance stats

It’s human nature for us to exaggerate when talking up our achievements. We tend to embroider facts about our relationships, families, work and homes, placing them in the best possible light while we push any uncomfortable truths which don’t fit our picture of perfection into the background.

Sales people do exactly the same, but we often don’t realise what they are doing because we want to believe the best about something we are about to buy. This is why project marketers, sellers’ agents and property spruikers will dress up their potential property investments to look their absolute best and why they get away with it.

This suburb has enjoyed Impressive past performance

When talking up an area’s past price performance, they will look for the stats that suit and ignore those that don’t. As this table shows, a spruiker selling property in Moranbah would tell you that house prices there have boomed by nearly 20% in the last year, not that they are still nearly 40% lower than they were five years ago.

A sellers’ agent trying to push property in Springvale South, however would show you that house prices have shot up by 50% in the last five years and ignore the fact that they have fallen by over 10% in the last year.

The area’s population is about to increase dramatically

Another commonly misused stat is projected population growth, trotted out to show you that an area is about to experience a substantial rise in population and therefore in housing demand. The stats used may relate to an entire region, such as South-East Queensland, and may have no effect on demand in already established suburbs.

It is also critical that any population projection indicates what types of households will be arriving, the types of housing they will prefer and their expected length of stay.  For example, the predicted rise in population may be for retirees, which would have no effect on first home buyer locations, or construction workers whose need for housing will be short term rentals.

These stats can be twisted to tell almost any story and mislead prospective investors. Even more important is the fact that while more households create more demand for housing, this will only lead to price growth if the supply of new houses falls behind the demand for them.

This infrastructure project will cause a massive rise in housing demand

Perhaps the sneakiest claim of all is the use of “infrastructure” in the spruiker’s bag of tricks to predict a housing market boom for areas where they are selling property. The project could be a new hospital, university, shopping centre, railway line, highway, airport or mine, and is often used to support their claims that housing demand will shoot up as a result.

The facts are that most infrastructure projects do not increase housing demand at all – they create demand which is directly related to their purpose – hospitals for sick people, universities for students, shopping centres for shoppers. Even railway line expansions, highway duplications and new mines may employ fly-in-fly-out construction workers on family friendly rosters, which means that any rise in housing demand will be where the construction worker families live and nowhere near where the project is located. Even more importantly, many infrastructure projects are altered, cut back, delayed or even abandoned altogether before they even start.

Check everything that they say – and then look for what they left out

Always be wary of any stats boasting impressive past price performance results, high population growth projections or claims that a rise in housing demand will be driven by new infrastructure projects. One good method to evaluate any spruiker’s claims about a potential property investment area is to check the origins of their stats – is this information sourced from reliable, independent and recognised data providers? Then check what they have left out and why: 

  • Will new households really be moving into the area?
  • What types of housing  will they prefer?
  • Will the new housing developments in the area lead to an oversupply?

It’s only natural for project marketers to talk up the benefits of investing in their new property developments, so it’s essential that you do your due diligence in establishing the accuracy of their claims.

Posted on

Beware of the modern day property prophets

Beware of the modern day property prophets

Thousands of years ago, we relied on wise men called druids or shamans to interpret the meaning of signs and predict the future. For example, when our forebears saw a solar eclipse, they thought that the sun was being devoured by some huge invisible monster as they stared upwards in horror.

They were unable to comprehend why this was happening, but the wise men knew all about eclipses and could even predict when they would occur.

Rather than impart this reassuring knowledge to the people, they told them something quite different.

‘Yes,’ they said, “a huge heavenly monster is eating the sun and only we, your protectors can save you – but this will be for a price.’ When the people had paid up, the druids assured them that they were scaring the monster away, and that the sun would soon return to its former glory, which of course, it soon did.

We still rely on modern day druids and shamans

Home owners, investors and potential buyers all want to know what’s in store; whether to buy, where to buy, what to buy, whether to hold or sell, and because most of us don’t know how to interpret the meaning of all those figures, stats, indicators and dynamics out there, you may have to rely on modern day druids or shamans to do this for you.

Whether they’re called property theorists, strategists, advocates, agents, advisors, educators or mentors these days, most of them will still only reveal the future if you pay them, just like the shamans of old.  

This is where it really gets complicated, because each of your advisors or educators may give you a different spin, depending on their own perspective and even personal interest. Who should you listen to and who should you avoid?

One expert is urging you to invest in Brisbane, another says buy in Perth, still another warns you that Brisbane’s housing market is about to crash, yet another urges you that Darwin is about to go gang busters. Who is right?

How to check their motivation, credibility and past accuracy

Well, there’s an easy way to test them. The internet makes this easy. You can check the motivation of any so-called expert by checking their website – do they claim to have “acquisition experts” on their team, or do they have access to “unlisted” or “off market” properties?

This code language means that they are probably seller’s agents or project marketers who will be getting paid a commission, finder’s fee or kick back for pushing a property on to you. In other words, the property you purchase will certainly be in their best interests, but may not be in yours. 

You can also check to see what others are saying about these experts. Google the person’s name, together with words such as “housing market” or “property expert” and see what pops up. You might be surprised!

You can also easily test their past accuracy. Using Google, go back in time and compare what they said some years ago about the property market to what actually happened.

Of course, not everyone can be right all the time, but at least by testing the accuracy of the those who claim to be experts, you’ll be better informed than our forebears were when they thought that the sun was being eaten.

Posted on

A Chinese ghost city

A Chinese ghost city

We tend to think of ghost towns as places where all the residents have long since packed up and gone, but in China some huge cities have recently been completed – built entirely on the opposite premise, that people will arrive.

One such new ghost city is Kangbashi, located on the barren steppes of Inner Mongolia, the home of summer sandstorms and freezing winters.

While it may be fairly typical of modern cities in most respects, Kangbashi stands out because of its remote location, its huge size, its impressive monumental architecture – and an almost total lack of residents.

A city built for over one million residents remains largely empty

Kangbashi was intended to house over a million residents and the city was virtually completed by 2009. Every possible need of the future residents was catered for, with sporting centres and stadiums, cultural galleries and museums, showcase architecture, monumental gardens and massive shopping centres.

The only thing missing was residents, as only a few thousand moved in when the building work was completed. The few westerners stumbling across Kangbashi at that time could not make any sense of what they saw – a huge city without people; it was a ghost city. 

Why was such a huge empty city built?

This prompted questions about the purpose of Kangbashi. Some cynics say that the city’s remote location indicate that it was designed to house people displaced from other parts of China in the event of a nuclear war, or other major catastrophe. It was designed to be a sort of refuge of last resort. However, given the scale of the city’s monumental artworks, impressive architecture and attempts to encourage tourism, this seems extremely unlikely.

Others claim that the city was built to help diversify the economy of the area, to encourage the impoverished rural communities in the region to relocate to Kangbashi, assisted by generous compensation packages. If this is true, then the city’s isolated location and harsh climate would not matter to people already used to such conditions.

Property investing is a form of life insurance to some

Another cause of the lack of residents is that many Chinese see property investment as a form of insurance, and buy new apartments not to rent out, but to keep brand new and unoccupied, as security for the future, like someone might hoard gold under the bed. Therefore, while many apartments in Kangbashi were purchased by Chinese investors, only a few have been bought for their owners to occupy.

Maybe the city just needs time. The population keeps growing steadily with nearly 200,000 residents at last count and nearly 5,000 local businesses operating successfully. Tourism is also growing steadily, and likely to rise even more as the city slowly springs to life.

If we build it, will they come?

The concept of a whole city being built on the premise that residents will follow is something we are not comfortable with in the west. The proof, if we need any, lies in the massively overdeveloped high rise, high density unit blocks in our inner urban areas whose owners are suffering from high vacancy rates and falling prices.

The issue is that these have been built by developers on the basis that past buyer demand reflects future buyer demand. Rental demand is not the concern of a developer, although it soon becomes one for the investor who buys a property.

In centrally managed and controlled countries such as China, prebuilding a whole city is quite feasible and residents can be created by encouraging or even forcing people to relocate.

It remains to be seen whether the vision will be realised and Kangbashi becomes a model for other such bold enterprises, but at this stage the ghost city is definitely slowly coming to life.


Acknowledgement: Image by Popolon – Own work, CC BY-SA 4.0, https://commons.wikimedia.org/w/index.php?curid=44947017


Posted on

Why our governments are building useful things

Why our governments are building useful things

In its July Statement, the RBA has stated why it has cut the official cash rate twice in just two months: “Easing of monetary policy will support employment growth and provide greater confidence that inflation will be consistent with the medium-term target.’

If you turn this “bank speak” into plain English, it means that the RBA thinks that unless we spend more, we are in for rising unemployment and may well slide into recession.

One of the main reasons for this unhappy situation is that, according to the latest HILDA survey, average Australian incomes have not risen in real terms (after being adjusted for inflation) since 2009. And so, the RBA is doing all it can to increase the amount of spending money we get each week. 

The value of safe haven assets keeps rising

We are not responding to this stimulus by buying more, so the Federal Government has chimed in with tax cut incentives, including a big once off income tax refund. But rather than planning huge spending sprees, most consumers are apprehensive.

They sense that the economic mood is changing and rather than spending more, they are spending even less, putting their spare cash into safe havens such as bank shares and gold (the graph shows the rise gold’s spot price in US$ since August 2018.)

The RBA can do little to prevent this decline in spending and in its July statement urged our governments to spend more money by building useful things to stimulate jobs and growth.

Build freeways, railways, tunnels and airports

The government knows that spending more, while foregoing revenue with its cut cuts will delay the long-awaited return to a balanced budget, but the alternative is far worse – being the first government to lead us into recession in thirty years.

That’s why the Federal Government, in concert with most State Governments are committed to an infrastructure-based approach to economic growth, building freeways, railways, tunnels and airports, all of which will help to reduce unemployment and put pressure on real wages to rise at last.

Real income growth will increase both housing affordability and buyer incentives, something which our exhausted housing markets are desperately calling for, but it’s going to be a very slow process. Investors would be wise not to seize on any slight rise in housing prices over the next few months as proof of a recovery, especially as potential sellers are likely to flood markets hoping to get higher prices, only to find their hopes dashed as buyer demand remains sluggish.

The “two-tiered housing market will soon return

This is why we are likely to see a “two-tiered” housing market dynamic occur once again over the next few years. The losers will be those capital city housing markets which experienced the highest price growth in recent years and also have large supply overhangs. The winners will be those areas which are likely to benefit from current or fully funded government infrastructure projects creating more housing demand. This is where rents and prices could rise dramatically.