Many believed that recurring lockdowns and working from home restrictions would lead to a baby boom, but it’s not in sight – yet. John Lindeman explains why, and what’s around the corner.
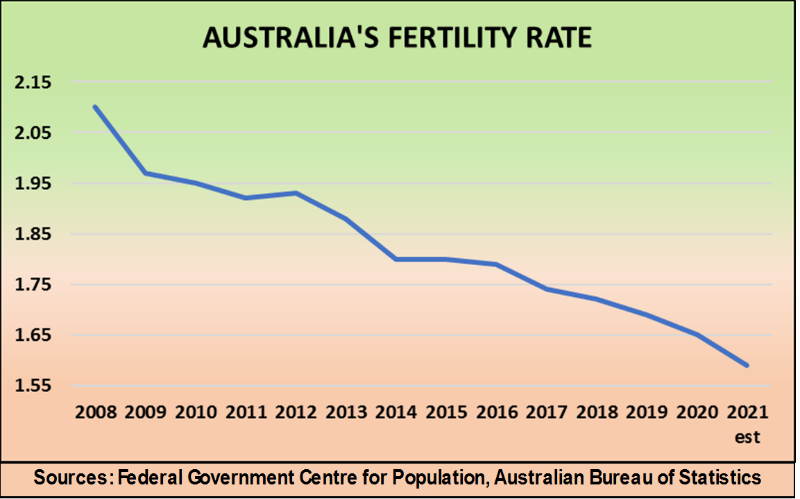
It seems natural that periodically locking down couples at home and closing public entertainment and recreation facilities would lead to more babies being born, but according to the stats, our birth-rate is falling, and the rate of decline has recently worsened.
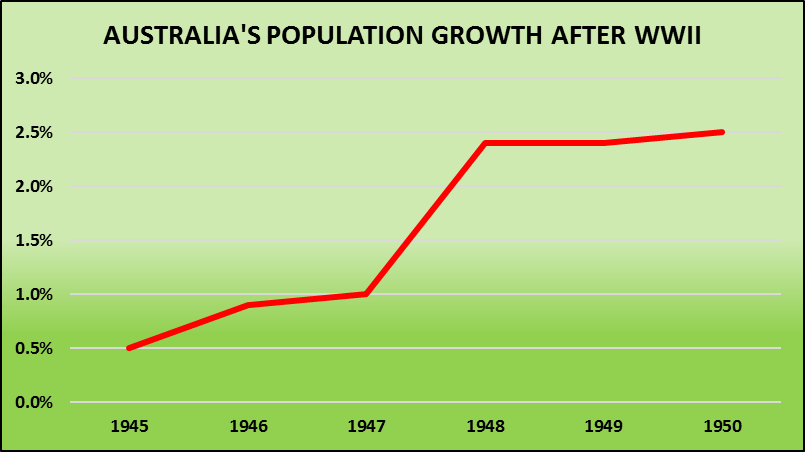
As this graph shows, the drop in our fertility rate has accelerated as fewer women choose to have babies.
The reason for this decline is that people tend to put off having babies during uncertain times. Birth-rates drop during recessions, famines, wars and periods of economic, social or political turmoil, and that’s precisely where we are right now.
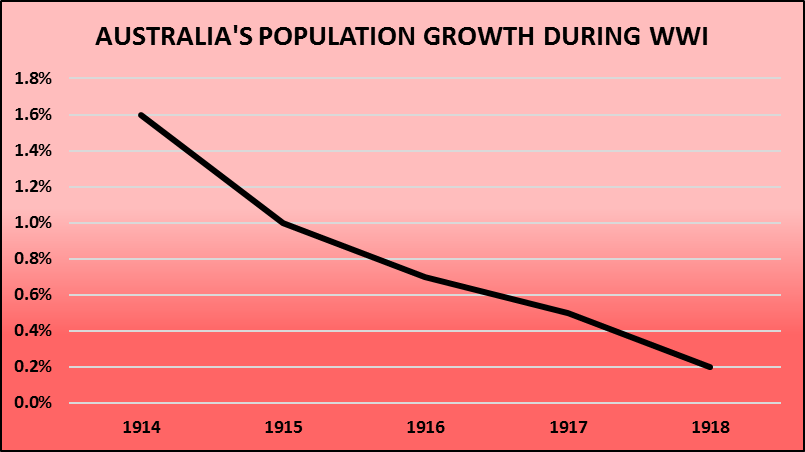
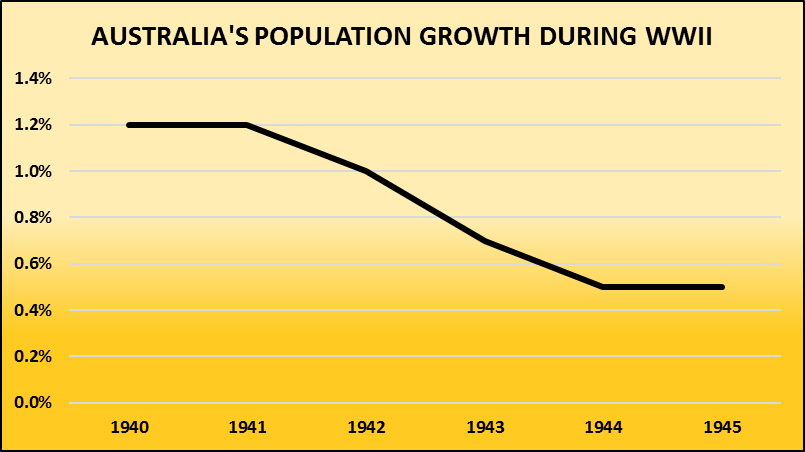
You can see in these two graphs how the same trend played out during the last periods of unrest and uncertainty that our nation experienced – the two World Wars.
Most of our population growth in the years before the First and Second World Wars came from births, but as the war years went on fewer couples decided to have babies, even though the opportunities to do were still there, especially when soldiers periodically returned home on leave.
Birth rates fall during times of crisis
This trend was very similar to the current decline. Although people may have more opportunities than ever to make babies, they are not motivated to do so, deciding that it’s better to wait until conditions improve.
Everyone hopes that the current crisis will not be as severe or last as long as those wars did. Although there are no guns or bombs to contend with, and the enemy comes in the form of a tiny virus, the result is much the same – fewer people are having babies.
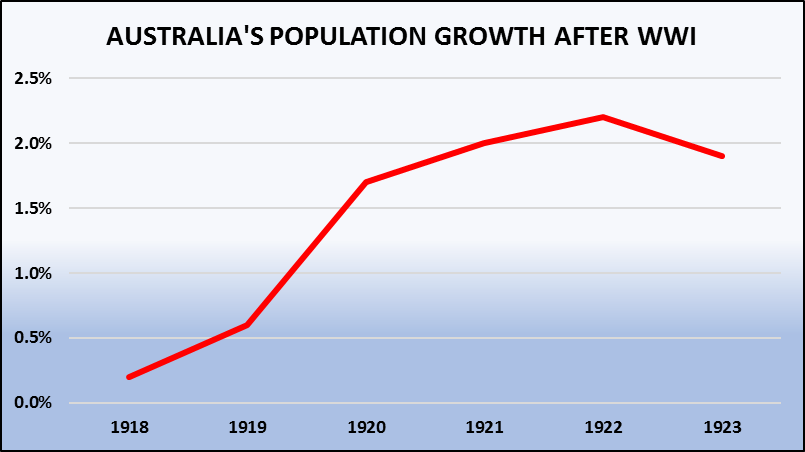
The real question is what occurred after each of world wars, when all that uncertainty and inaction was replaced by optimism and enthusiasm? And the answer is that we had huge baby booms.
After each war ended, people started having babies in larger numbers than ever before, and the population growth rate reached record levels.
An entire generation of Australians, now known as baby boomers. was born as households swelled in size to include three, four or even more children.
This crisis will be overcome
Past pandemics have always been conquered, whether by strict immunisation protocols or the development of new, more powerful vaccines. The Spanish flu pandemic caused an estimated twenty to fifty million deaths worldwide from 1917 to 1920, but now we accept one annual flu shot as an adequate defence against all forms of influenza.
Another virus, called poliomyelitis killed over one thousand Aussie children in the post war years and tens of thousands were left permanently paralysed. Not only was an effective Salk vaccine developed in the 1950’s, but the improved Sabin version is now administered orally, on a spoon or a sugar cube. There’s no need for a needle, and Australia has been officially polio free since 2000.
We have nothing to fear and everything to hope for regarding the future as far as COVID-19 is concerned as well. When the virus is finally behind us and confidence returns, we are very likely to experience another baby boom, just as we did when those past crises ended.
The baby boom could lead to a housing boom
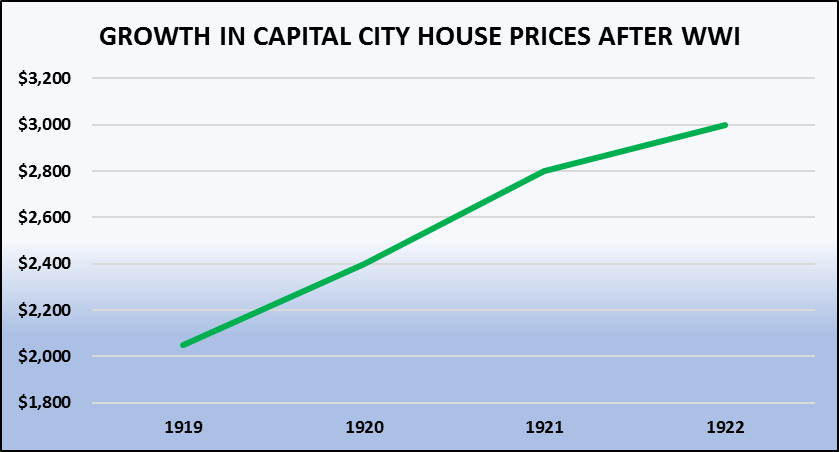
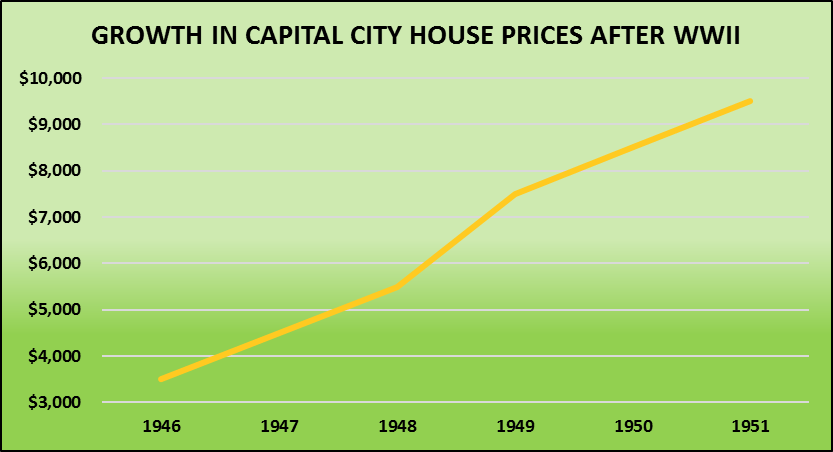
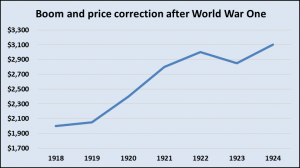
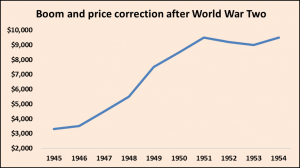
The graphs show that Australian capital city house prices rose by over fifty per cent in the four years after the First World War ended, as our population growth rate soared. In the six years following the end of the Second World War, house prices shot up by an incredible one hundred and seventy per cent as the demand for housing dramatically increased.
Not only were people having more babies, but we also welcomed refugees and migrants from war ravaged and economically devasted countries, resulting in the highest population growth rates we have ever experienced as a nation, before or since.
What this analysis is telling us is that when all the current uncertainty is finally over, another baby boom will begin and large numbers of overseas arrivals will migrate here as well. Then we can confidently expect the housing market to boom again as well.
Sources
Federal Government Centre for Population A century of population change in Australia, Australian Yearbook 2001 Time Series Profiles, Australian Bureau of Statistics Australian National Library Trove facility and Mitchell Library archives House Price Indexes: Eight Capital Cities, 6416.0 Australian Bureau of Statistics Housing Market Prediction Solution, Property Power Partners Mastering the Australian Housing Market, John Lindeman, Wileys
We can expect many webinars, blogs, even free reports about how the Brisbane Games will turbocharge the housing market. To sort out the fantasy from the facts, property market analyst John Lindeman explains what effects the Brisbane Olympic Games could have on property prices.
After the current Olympics conclude, we’ll have the Paris Olympics in 2024 and then the Los Angeles Games in 2028. The Brisbane Olympics are a long eleven years away, but could the local property market be heading for some big changes well before construction begins, ticket sales open and spectators start arriving?
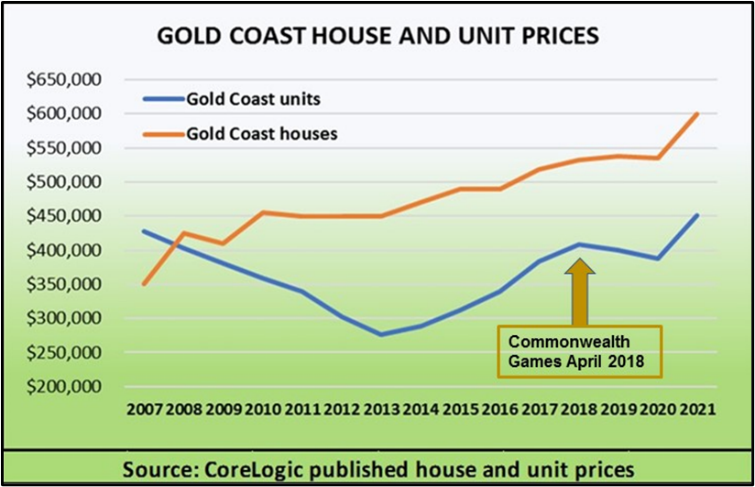
We can find the answers by looking at what took place in the Gold Coast property market as a result of the Commonwealth Games held there in April 2018.
After the completion of specially built and improved sporting, transport and accommodation venues, the economy was boosted by the arrival of local, interstate and overseas visitors. So ,what changes occurred to the property market before, during and after the Games?
Before the Games – massive infrastructure projects
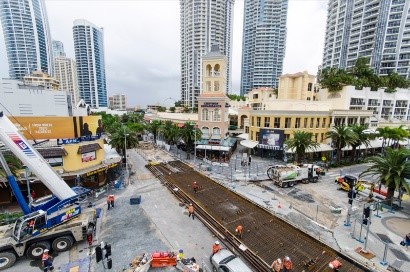
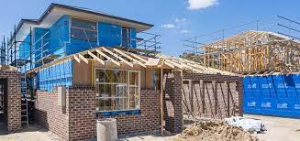
Getting the Gold Coast ready for the games involved massive spending on new infrastructure, such as improving and constructing sporting centres and building the G-Link light rail to provide easy access to the venues. This naturally led to a rise in the number of construction workers, but did this then also lead to an increase in housing demand?
The facts are that most infrastructure projects do not increase housing demand at all – they create demand which is directly related to their purpose – hospitals for sick people, universities for students, shopping centres for shoppers, sporting events for spectators.
Infrastructure projects carried out in remote or captive markets tend to increase demand for rental accommodation from workers, because they need to relocate there while construction is in progress. This is not the case in major cities, because the construction work is largely carried out by local contractors who already live in the area.
This is what occurred during construction of the facilities for the Commonwealth Games, with extra workers from Brisbane and other nearby population centres commuting to and from home, rather than renting locally during the construction phase. As a result, there was little to no rise in rental or home buyer demand during the years prior to the Games.
The projects did, however, cause some disruption to retail and commercial business, especially with the building of the G-Link light rail disrupting the centre of popular tourist precincts such as Southport, Main Beach and Surfers Paradise.
In those areas, noise, dust and road closures had a negative impact on both retail and residential housing demand.
During the Games – huge boost to tourism
Over one million interstate and overseas visitors attended the Commonwealth Games, and gave the local tourist industry a huge shot in the arm. The accommodation and tourist industry such as hotels, motels, entertainment facilities, restaurants and specialist retail shops all benefitted, although the rise in demand was only temporary.
As the increase in demand was for short stay accommodation, it did not ripple through to the housing market, except for a temporary rise in accommodation services such as Airbnb.
After the Games – better facilities and more tourism
The legacy of the Games has been improved and specially built sporting venues and of course, the G-Link light rail which is gradually being extended all the way to the NSW border. There was also a rise in international tourism to the Gold Coast, especially from Commonwealth countries in 2018-19, but this quickly dissipated after the outbreak of the COVID-19 pandemic.
When looking at what effect, if any, that all this activity may have had on the local property market before, during and after the Games, it is important to realise that there are two different types of property and that they can behave very differently from each other at such times.
The Games had no effect on the Gold Coast house market
With well over half a million residents and two hundred thousand dwellings, the Gold Coast is the sixth biggest city in Australia, but what makes it unique is that one quarter of the city’s dwellings are units. As the graph shows, these two markets performed very differently in the years leading up to the Commonwealth Games.
Gold Coast house prices dipped slightly after the Global Financial Crisis (GFC) in 2008, but then rose slowly until another small price correction occurred as a result of the social and economic uncertainty caused by the COVID-19 pandemic.
The data shows that the Games had no apparent effect on the rate of house price growth or any other measurable impact on the Gold Coast house market.
The Games had a big effect on the Gold Coast unit market
The unit market had a very different experience. The graph shows that the Gold Coast unit market entered a sustained period of price decline after the GFC, when it was abandoned by overseas and local investors. Confidence and buyer demand returned after 2013-14, with the unit market even experiencing a mini-boom, but even so prices have only just returned to their pre GFC levels.
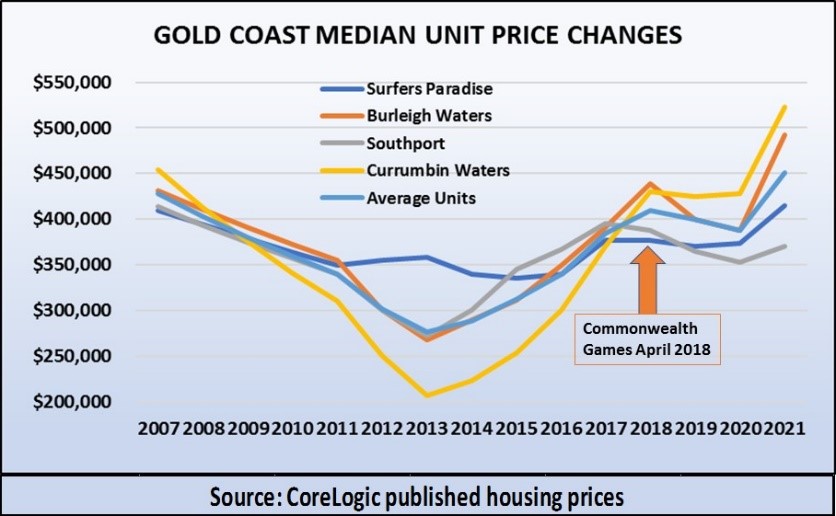
This graph shows how unit prices fluctuated before, during and immediately after the Commonwealth Games. Unlike houses, where there was no noticeable effect on prices, unit values rose steadily in the lead up to the Games, creating a bubble, bursting when the Games were over.
This picture is typical of speculative investor booms when they become bubbles and then burst when the incentive to buy property stops.
The reason that this took place in the Gold Coast unit market and did not affect house prices is because units are ideally suited to speculative investment. They can be sold off the plan in large numbers well before construction even starts and promoted to overseas and local investors with generous rental guarantees coupled with assurances of rapid and imminent price growth.
Who made a profit from the Gold Coast unit market boom?
Did any property investors profit from the Games? The data shows that unit prices on the Gold Coast, especially in suburbs such as Currumbin Waters and Burleigh Waters rose by fifty percent and more in the few years before the Games were held, so some profit taking was likely.
Based on this experience, it is possible that such a speculative bubble could form again in the lead up to the Brisbane Games in some of the city’s unit markets, but it is unlikely to have any impact on house prices.
Could investors make a profit from the Brisbane Olympics?
There will undoubtedly be a rise in speculative investment in the lead up to the Olympic Games, and unit developments are the obvious candidates. As new unit developments located near proposed Games venues are announced, speculators will quickly purchase the first available off the plan. They will then watch and wait as both local and overseas investor interest rises with the new developments being sold internationally.
Project marketers and sellers’ agents will promote them at free events and seminars with low deposit bonds and attractive rental guarantees using the glitz and glamour of the coming Olympic Games to motivate and entice purchasers.
Using the 2018 Commonwealth Games unit market experience as a guide, we can expect informed speculative investors who have purchased units a few years before the Olympic Games to offload them just before the Games begin. They will try to time their selling point just when excitement is at fever pitch and prices are at their peak.
It seems highly likely that the only real changes to the Brisbane property market caused by the Olympic Games will be from speculation. The trick will be knowing what to buy, when to buy, where to buy and most critically, when to sell. If this opportunity seems tempting, remember that the possible gain from property speculation may not outweigh the obvious potential for loss, and of course, there may be much better property investment opportunities with less risk to be found elsewhere.
Some property market experts and analysts promote a buy and hold strategy, called “time in the market” and others advocate a buy and sell strategy known as “timing the market”.
But sometimes, the same experts will switch from one strategy to the other. For example, early last year, when most experts expected a pandemic induced property market downturn, the call was no, you can’t time the market, but now that the market is booming, that’s all changed to yes, you can time the market.
Does this mean that you can time the market at some times, but not at others? Or is there something else going on? To find out, let’s look at how these two very different investment strategies are presented.
Time in the market means buy and hold
Experts promoting time in the market claim that investing in property is a long term strategy. They’ll say that it’s difficult if not impossible to predict imminent changes, and even if growth stops for a while it doesn’t really matter, because prices always go up over time.
In fact, they’ll assure you that prices double every eight to ten years, so you can use the power of compounding growth to accumulate wealth over long periods of time.
This approach means that it’s always a good time to buy and then rely on time in the market to watch your equity grow.
Experts pushing timing the market claim that buying for imminent growth and avoiding downturns is much more profitable than buying and holding for the long haul, because property market performance is predictable, even in the short term.
They forecast the imminent future with tools such as the property clock or the property market cycle to reveal when and where the market is moving into a growth phase, and prices will soon rise.
They say that timing the market enables you to buy at the right time and in the best location to ride the next wave of price growth.
So, which strategy achieves the best results?
It would seem that timing the market works best when we know which way prices are heading, and that time in the market is safer when we don’t know what is around the corner, but this misses the point.
Achieving average market driven growth with the same property over many years is nowhere near as profitable as buying for high growth and selling when the growth wave has passed.
This means that timing the market will always be the most successful strategy to achieve wealth from property, as long as we know how to find those locations with the best imminent price growth potential.
The closing of our national borders to overseas arrivals is impacting population growth in some States and Territories, but is also causing cash flow booms for property investors in others. John Lindeman reveals where to find them.
It’s understandable that much of the focus on international border closures caused by the pandemic has been negative, because lower population growth ultimately means less demand for housing. For example, we know that housing demand in locations where overseas students, tourists and migrants were renting prior to the pandemic has been hit hard, especially in Melbourne’s inner urban unit market.
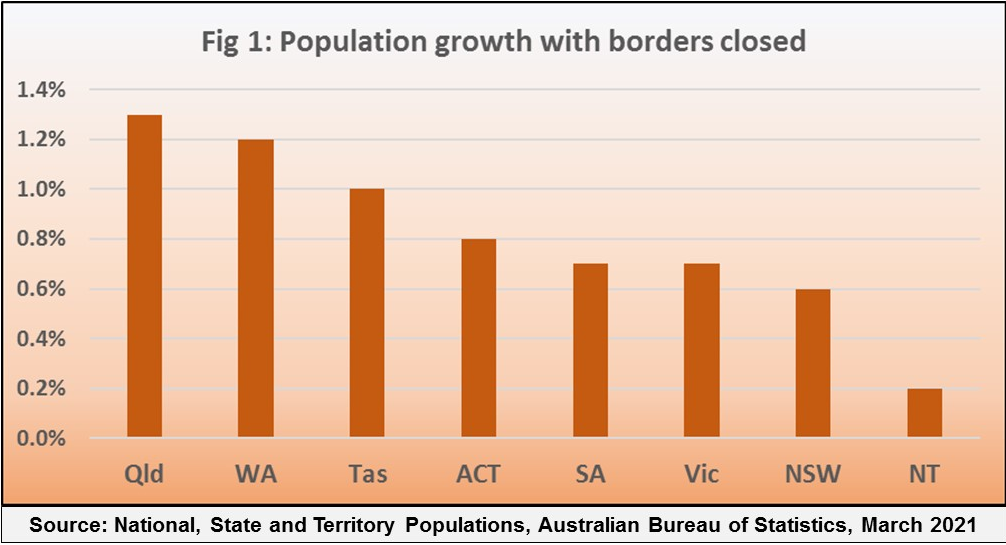
But, looking at the positive side, the latest ABS data indicates that population growth in States and Territories less reliant on overseas arrivals has been quite strong, as Figure 1 shows.
Since our national borders were closed early in 2020, Queensland’s population has grown more than any other State with a net increase of 68,200 residents over the last year. The State’s annual population growth rate of 1.3% is now the highest of all our States.
Victoria, on the other hand, which had the largest increase in population before borders were closed, has slipped back to third spot, and its annual population growth rate of just 0.7% has fallen below that of most other States.
This dramatic change is mainly due to the collapse of overseas migrant arrival numbers, especially to States such as New South Wales and Victoria. but a significant number of people are also relocating from the southern States to Queensland.
Nearly half of Queensland’s new residents relocated from New South Wales and Victoria, meaning that their loss was Queensland’s gain. This new trend is likely to continue until well after our international borders re-open as the popularity of our major population centres undergoes a significant realignment.
In years gone by, Queensland was a popular retiree destination, but we are now seeing large numbers of young people moving there. Many of them are recent immigrants who have decided to move once again. They don’t have the personal, family or workplace ties that deter people from relocating and they are attracted to Queensland’s climate, recreational lifestyle, employment opportunities and cheaper housing costs.
Most of Queensland’s new households are renters
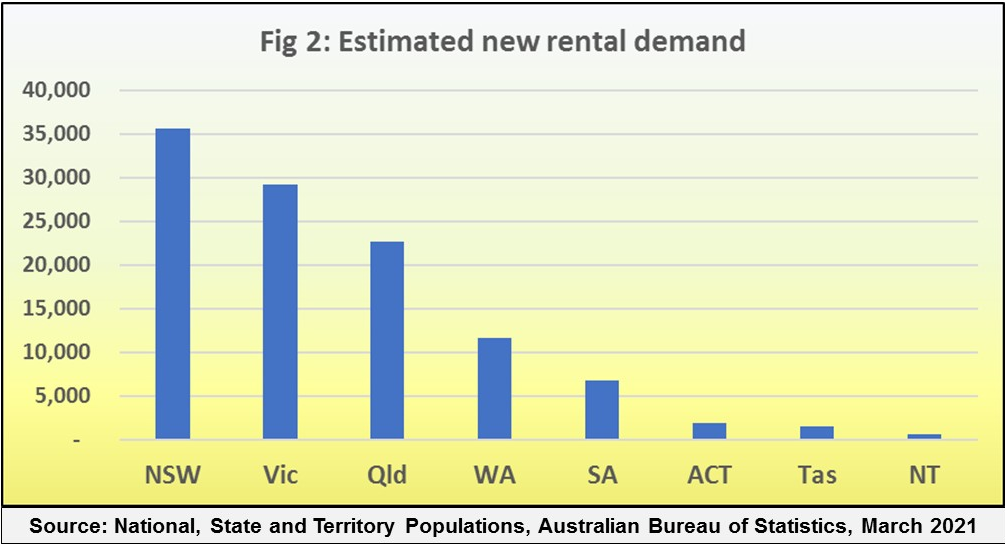
The significance of these numbers for property investors is that most of the new households are renters. Figure 2 shows that rental demand is growing in all our State and Territories, with the numbers of new renting households in New South Wales and Victoria being higher than other States purely because they are the biggest State in terms of population. The real show stopper is Queensland, because rental demand there is rising far more strongly than in the other States.
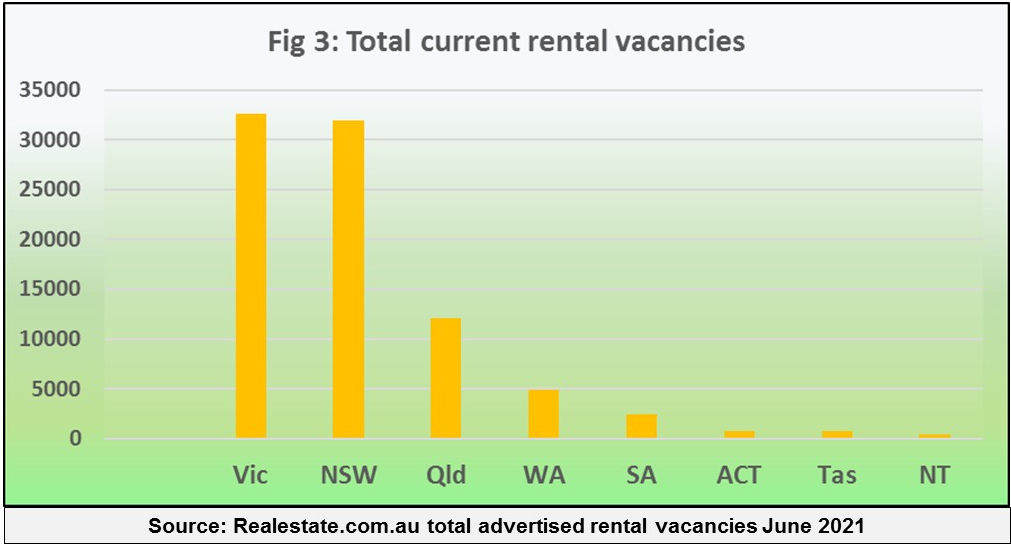
These numbers become more significant for property investors when we also look at the supply of rental properties, that is, the number of advertised rental vacancies in each State and Territory. I have done this in Figure 3, which shows that both New South Wales and Victoria are well out in front in terms of rental vacancies.
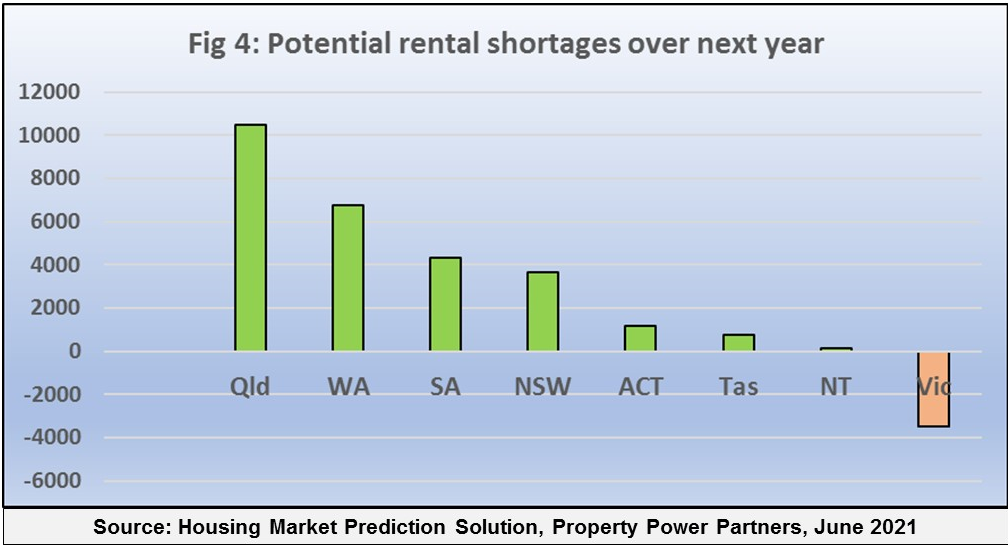
Rental vacancies are created when tenants move out, or when investors buy newly built or owner-occupied properties. To compare the overall rental demand to the available supply, we can use the population growth figures provided by the ABS and compare them to the number of rental vacancies in each State and Territory. I have done this in Figure 4, which reveals the States and Territories where rents are likely to rise and those where they may fall.
The comparison reveals that Queensland has a huge undersupply of rental properties compared to the demand for them, followed by Western Australia, South Australia, New South Wales and the other State and Territories. Victoria is the only State with an overhang of rental vacancies.
This “top down” type of analysis indicates where asking rents are likely to rise and fall until our national borders are open again, but only in very general terms. There could be locations in Victoria with rental shortages, just as there could be some suburbs in Queensland with high numbers of rental vacancies compared to the demand. Even so, rents are much more likely to rise in Queensland and Western Australia than they are in the other States and Territories.
We all know that all property booms eventually come to an end, so what will happen to property prices when the current boom is over?
Property booms don’t all finish in the same way. Booms where investors have been heavily involved can become superheated bubbles and then they bust, with prices crashing. In fact, as price growth comes to an end, we can expect the usual dire warnings of an imminent property market crash to make headlines in the media.
The current boom, however, has been caused by home buyers rather than investors, so does this mean that growth will eventually slow down when demand falls? Can we expect prices to stabilise rather than crash and then look forward to price booms in other locations?
The best way to forecast what might happen to property prices is to look back to past property market booms which were generated by home buyers rather than investors, and see what took place when they ended. These booms occurred after the end of World War One, the end of World War Two and before the GFC.
How the biggest property market booms of the past ended
When the First World War ended in 1919, large numbers of soldiers returned home to start families, followed by migrants and refugees fleeing war torn and ravaged Europe.
The demand for housing resulted in severe shortages and house prices rose by over fifty per cent in a few years, as the graph shows.
The same situation developed again after the Second World War ended in 1945, and for the same reasons, as soldiers returned home and huge numbers of migrants and refugees arrived, resulting in housing shortages.
This was our biggest boom ever, with house prices almost trebling in just five years.
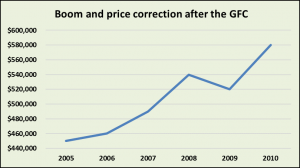
The third home buyer boom took place after the Federal Government’s introduction of the First Home Owner Grant in 2000, and continued until the Global Financial Crisis in 2009.
During this boom, house prices doubled in less than seven years.
Apart from the massive increases in prices that took place, each of these graphs also shows us that when the housing market booms ended, prices did actually fall.
The price falls, however, were quite small, only decreasing by around five percent at the end of each boom and more significantly, the market then recovered after each correction had occurred and moderate price growth returned.
Why do all home buyer booms end?
Big home buyer booms finish for a number of reasons. Price growth can stop when new property development eventually catches up to buyer demand, and the newly released stock results in temporary oversupplies.
Sometimes house prices have risen so much that potential buyers simply can’t afford them anymore, and some booms end because the number of potential buyers has been exhausted and there’s no more buyer demand.
Why do prices fall when home buyer booms end?
Just before booms end, potential buyers are frantically competing to snap up the few properties for sale on the market. These are often bought at prices well above market value, which would be fine if buyer demand continued, but as the boom ends, the value of these homes can fall below what the new owners have paid.
This wouldn’t matter if the last purchasers in a boom could hang on to their homes until growth returned, but sometimes that isn’t possible.
Many new owners decide to renovate or make other home improvements and most first home buyers need to splash out on whitegoods, floor covering and furniture. This additional expenditure increases their debt levels and may impact the capacity of some new owners to service the loan.
Others may be forced to sell because of work relocation, unemployment, or relationship and family issues.
This leads to an increase in unexpected or even forced home sales at the end of a boom just when the number of buyers has decreased and causes prices to fall. Such crisis induced sales only last for a number of months, as most new home owners are reluctant to sell and try to hang on to their homes until their situation improves.
As the above graphs show, the net result has always been a small correction in house prices of around five percent over the twelve months that follow the end of a boom. There is no reason to believe that this boom will end differently.
Why does price growth usually return?
Once these small corrections have occurred and our big city post-boom markets have stabilised, they usually enter a period of subdued but constant growth which can last for years. This is because the demand for housing in our major urban centres has always outpaced the supply, being driven by the constant arrival of new households from overseas, with each household requiring their own home to live in.
With our border firmly shut, population growth now comes only from new babies, who don’t increase the demand for housing as much as for more bedrooms.
This means that until overseas migrants are able to resettle here again, our property markets may enter an extended period of little to no growth.
This is of course, apart from areas where people are likely to relocate in a different part of their State, or from one State to another, because this creates more housing demand in the process. It is those locations which will have potential to outperform the overall market over the next few years.
Sources:
CoreLogic published housing data Australian National Library Trove facility and Mitchell Library archives House Price Indexes: Eight Capital Cities, 6416.0 Australian Bureau of Statistics Housing Market Prediction Solution, Property Power Partners Mastering the Australian Housing Market, John Lindeman, Wileys Stapledon’s Index: Long Term Housing Prices in Australia, Nigel Stapledon, University of NSW
When property investors talk about size, they are referring to population. Some won’t even consider a potential investment location unless there are at least 5,000, or 10,000 or even 20,000 people living there, but is there any logic to using size as a benchmark?
Size is one of those accepted truths about the property market. It’s based on the fact that people create economic and demographic diversity, so the bigger the local population, the more robust and stable its housing market is likely to be. This is why many property investment courses and books tell you to limit your search for possible investment properties to towns or even cities with a certain minimum population.
Population size can be misleading
I would argue that it’s not the size that matters so much as whether the population is growing or declining, because population falls cause lower demand for housing, leading to falling prices, longer rental vacancy rates and lower rents, regardless of how big a city might be. On the other hand, population growth, even in a small town will generate more demand for housing.
It’s also critical to know what types of households are moving into an area, and what types are departing. For example, a recently completed highway expansion or new railway project could result in many of the construction workers who rented in town leaving, but also motivate home buyers to move in, because the area is now quicker, easier and safer to access.
Market activity is more important than size
Much more important than an area’s size is the amount of property market activity that’s taking place there. You can easily check this by looking up the property sales, rental vacancies, listings and time on market in any suburb or locality.
Even a small town might be buzzing with new buyers or renters and you might miss an obvious investment opportunity if you rely purely on the town’s size.
Size does not guarantee economic stability
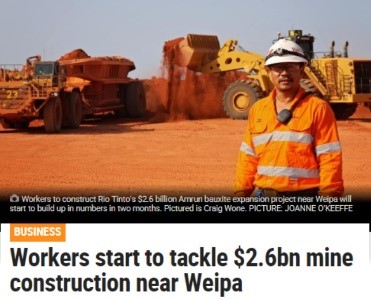
Even some large Australian cities rely heavily on one or two main industries to provide employment and economic growth such as tourism, manufacturing, horticulture or mining. If these key industries decline there’s a knock on effect to other local industries such as retail, entertainment, educations, and administration and so the property market suffers.
The important thing to look for is not diversity, but whether the main industry in a small town has growth potential, because this will also have a knock on effect to other industries in the town and lead to more housing demand.
For example, the arrival of over 1,000 construction workers in remote Weipa (total population of 4,000) led to a massive and sustained rise in both rents and prices.
When doing your research for potential investment areas, don’t just rely on size, but also look at expected growth in population, increasing property market activity and new or expanded economic projects.
John Lindeman strips the market bare to find out why housing prices are shooting up almost everywhere and reveals what will happen next.
There are many explanations for the current housing market boom, such as lower interest rates, relaxed borrowing rules, buyer grants, building incentives, stamp duty waivers and tax cuts. But while these have all contributed in some way to the rise in buyer demand, they don’t explain the dramatic increase in the number of potential buyers, or the huge rise in their buying power.
When we strip the market down to the basics, we are left with just two facts that explain why housing prices are booming and tell us what’s around the corner. That’s because property purchases consist of two amounts – your deposit, and what the banks will lend you.
The banks require you to make a significant deposit on the purchase price of your property, because this protects them from risk if its value falls.
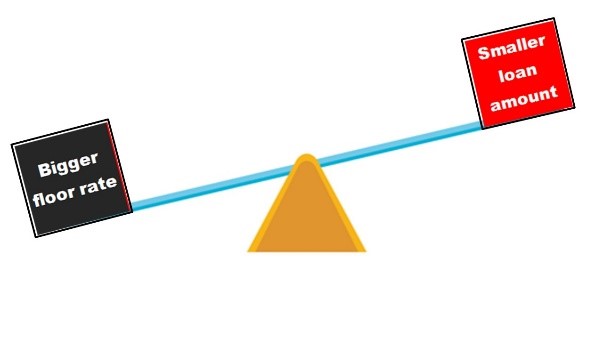
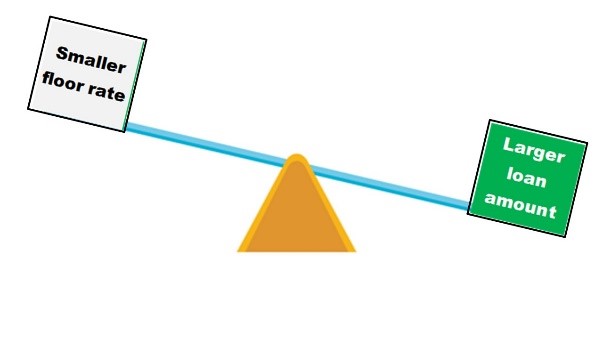
They also need to protect themselves from risk if interest rates rise, so they apply a floor rate which is two or three percent higher than the standard variable rate to your loan application. This serviceability test shows whether you can keep up repayments if interest rates go up and it controls the amount of housing finance that they will lend you.
These solutions have always made it difficult for first home buyers to obtain housing loans, but now everything has changed, and it’s largely because of the pandemic.
There are more potential home buyers than ever before
The need to have a big deposit has always been the first big stumbling block for potential home buyers. But last year, we had to endure lock downs, social distancing and border closures while many people worked from home. We stopped spending on travel, clothing, recreation, entertainment and holidays and saved the money instead.
As a result, many aspiring home buyers have managed to save enough for a deposit and so the number of potential first home buyers has increased dramatically, with a fifty percent rise in first home buyers entering the market over the last year.
Banks are willing to lend more to each potential home buyer
But it’s not only the number of first home buyers that has increased – the amount that banks are willing to lend has also gone up. This is because the banks have significantly lowered the floor rates against which they test home loan serviceability.
During the pandemic, lenders lifted their floor rates to seven percent and more, because they were worried that a severe economic recession was heading our way.
Now, however they have dramatically cut their floor rates because the economy is back in growth and the RBA has given an assurance that interest rates won’t rise for some years. The result is that potential home buyers have received a massive uplift in their assessed loan serviceability and higher loan amounts are being approved.
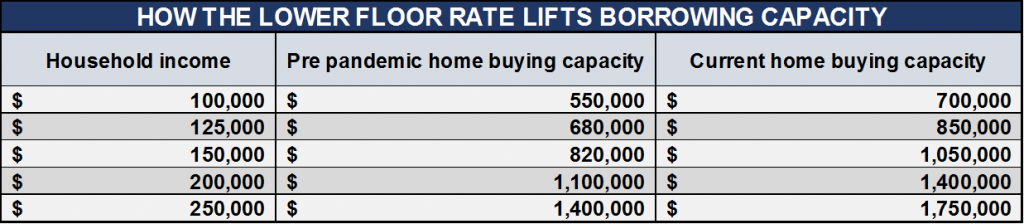
For those who like stats, this table shows the greater home buying capacity that the lower floor assessment rates have given potential buyers, when this is based on their household income. On average, the reduction has given home buyers the capacity to lift sale prices by up to twenty-five percent or more above pre-pandemic levels.
The three growth governors will soon kick in
Now you can see why there are not only more potential home buyers in the market almost everywhere, but that they can offer higher prices as they compete with each other. So what happens next? Watch for these three growth governors:
The number of home buyers entering the market will start to fall.
Loan size limits set by the banks’ lower floor rates will be reached.
More current home owners will be motivated to “cash in” and try to sell.
As these growth governors take effect, there will be fewer buyers in first home buyer suburbs with more potential sellers and price growth will slow down.
We are already seeing evidence of this trend in many of the lowest priced suburbs of the Outer Sydney Rim (such as Penrith, the Lower Blue Mountains and Campbelltown), where the number of properties listed for sale has risen in recent months. This gives us a clear indication that the peak of the market is already close to being reached in these first home buyer locations.
While buyer demand is now rippling to higher priced areas as existing home owners decide to upgrade, the same growth governors will eventually limit the size and duration of price rises.
Some areas could be in for a wild ride though, if their house prices grow by more than twenty-five percent over pre-pandemic levels. Remember that the higher the price rises, the more likely it is that these areas will suffer price corrections as the market cools down.
Ever heard of the power of compounding growth? You’ll often see it promoted as the reason that property investment can provide such great results. But does it really work? John Lindeman investigates.
Many experts assure you that property investment is a long term game because prices always rise over time. Future growth builds on past growth, delivering the snowballing result called compounding growth.
Because of the power of compounding growth, some strategists even insist that timing the market is futile. By this they don’t mean that its future performance is unpredictable, but that it is simply unnecessary to try and predict the future – all we need do is buy and hold.
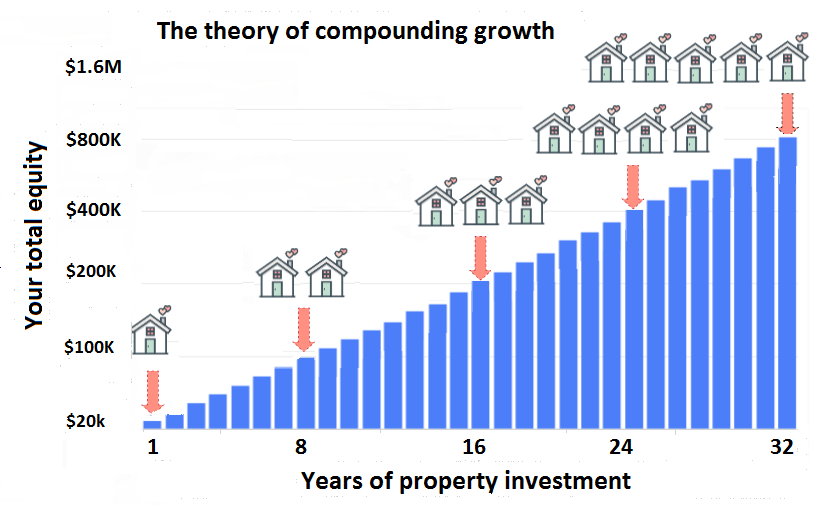
They point to the long-term performance of property and show you how its regular and consistent price growth exponentially increases your equity over time, as demonstrated in this commonly used illustration of the power of compounding growth.
Compounding growth seems to offer you a secure pathway to wealth, because as your equity grows, you keep buying more properties until you reach your final goal.
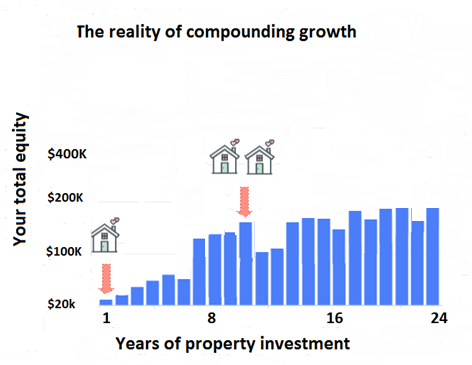
Most investors only ever get to own one or two properties
If only this were true! Yet the facts are that very few property investors own more than two properties. According to the ATO1, ninety per dent of property investors only own one or two investment properties and are seemingly unable to make the power of compounding growth work for them. But that’s because the theory doesn’t work in practice, for two very critical reasons.
Firstly, unless your properties generate positive cash flow, you will quickly hit a borrowing ceiling, because banks won’t lend you any more money. Most properties are negatively geared, which means they cost more to hold than the income they generate, so you are actually losing money, and your borrowing power is quickly exhausted.
Secondly, although property prices do go up over time, price growth can dramatically vary from one location to another, even at the same time. Some areas may not experience price growth for a decade or longer, while others experience short but sharp bursts of growth which are then followed by years of price stagnation.
Theory and practice are different
Einstein once said, “In theory, theory and practice are the same, but in practice, they are different.”
The chances of hitting a property jackpot are slim indeed if we buy and hold without achieving both consistent positive cash flow and high price growth.
This is why most investors never get past owning one or two investment properties.
Their experience shows us that relying on the power of compounding growth alone is totally flawed.
Those few investors who have managed to increase both their equity and portfolio over time and achieved their wealth creation goals have a secret – they always purchase the right properties in locations with high positive cash flow as well as the potential to generate high price growth.
Source: 1 How many properties do investors own? Michael Yardney, YIP Mag blog 12 Dec 2018.
Warren Buffet has just two rules that investors must follow to ensure success. His first rule is Never lose money and the second is Never forget the first rule. So how can investors use this wisdom to profit in the current market?
It would seem that getting into a growth market is the best way to avoid losing money, and in fact many investors do just that, by holding off buying properties until they are sure that prices are rising.
There’s an issue with buying in growth markets
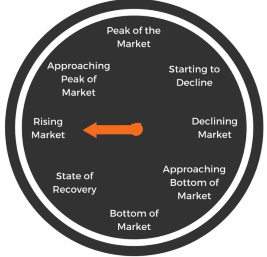
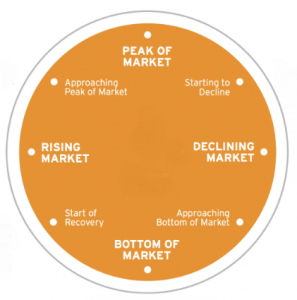
The issue is that property market performance in a city, region or even a suburb moves in a recurring pattern of growth and decline, as the picture shows.
When we are in a growth phase such as the current one, it’s critical to know just how long prices are likely to keep rising. Are we still at the beginning, with more good growth to come, or are we already near the end? This is because sooner or later, prices will become unaffordable, or current buyer demand will be met and growth will end.
When growth ends, markets go into decline and eventually bottom out, sometimes for years, before demand grows again. It’s those investors who enter a market when prices are about to increase who make the most money.
On the other hand, the last buyers to enter a market before prices peak stand to lose, because they have purchased just before the declines set in.
So how do you know that the market where you intend to purchase an investment property has plenty of growth potential left in the tank? The answer to this is not measured by the length of time that price growth has been occurring, nor is it indicated by the amount of growth that has taken place. The answer is revealed by the types of buyers creating the demand.
Different types of buyers create different types of demand
Property buyers come in different groups, such as first home buyers, upgraders, downsizers and investors. Each of these has different motives and limits when it comes to buying property, so if we know which group is doing most of the buying, we can estimate when the growth is likely to end. And if we correctly forecast which group is likely to be next, we can buy just before the growth really kicks in.
Investors for example, are motivated only by profit. They enter markets when prices are rising and the more that prices rise, the more investors want to buy.
On the other hand, owner-occupiers are motivated by affordability. They enter markets when borrowing conditions are easy and finance costs are low. The more that prices rise, the fewer of them can afford to buy. Then, when the new affordability ceilings have been reached, owner-occupier demand slows and price growth stops.
In the current market, most buyer demand is being generated by owner-occupiers, not investors. Although that means there’s a limit to the growth that can occur, it also means that investors can take advantage by buying property in areas that have not yet experienced growth, but have the potential to.
Where to wait and where to jump in
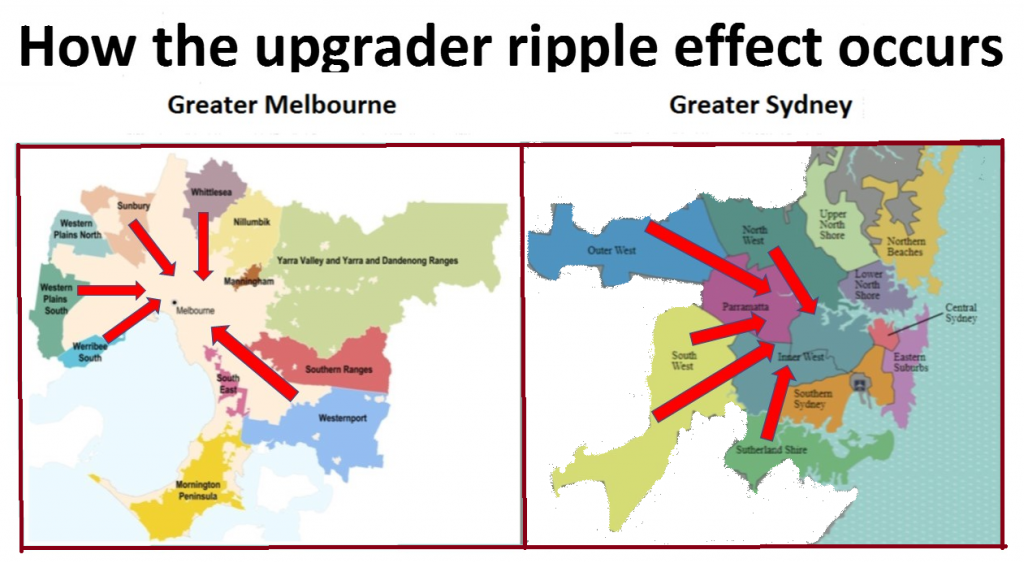
As new affordability ceilings are reached, growth in first home buyer suburbs will slow down and then ripple to more affluent areas as upgraders take advantage of their increased equity and favourable borrowing conditions. This means that suburbs in well-established, desirable locations are highly likely to be next to rise in price as upgraders move and improve, indicated in these examples for Sydney and Melbourne.
Not only will many potential upgraders living in outer first home buyer suburbs move to better homes, but they will also relocate to more suitable suburbs. Investors who buy well-appointed, low maintenance properties in locations with excellent transport, recreational and retail services will be following Warren Buffet’s first rule – Never lose money, as they sit back and watch the price surge occur.
Some experts are claiming that our property markets are heading for a boom, while others are warning that we could soon be in a price bubble about to bust. John Lindeman gives us his take on what lies ahead.
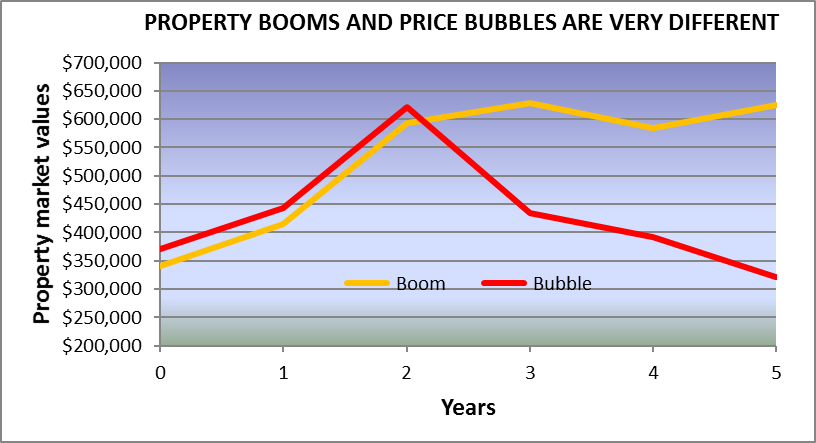
There’s a huge difference between property booms and price bubbles. Bubbles invariably bust and when they do, housing prices end up much lower than where they started. Property booms, on the other hand eventually run out of steam with an occasional small price correction followed by a prolonged period of little to no growth.
The issue is that they both look the same at the start, as this graph shows.
So what’s the difference between a boom and bubble? It’s the type of buyers causing the growth. Buying demand from investors grows when prices rise and the more that they increase, the more that investors want to buy properties. Owner-occupier booms take place despite price growth and the more that prices rise, the more that demand slows down and then stops as prices become unaffordable.
Only investor led booms can become bubbles
Investor led booms can become bubbles because investors don’t buy properties to live in, like owner-occupiers do. Profit is their only consideration, and fear of loss their only concern.
This means that when price growth slows down or stops, investors start to put their properties on the market and try to sell. When the number of properties for sale exceeds buyer demand, prices start to fall. Panic starts to set in as more and more investors try to sell and because no one wants to buy, the bubble busts.
Owner-occupier booms merely slow down and when they end prices don’t crash, because the purchased properties are now people’s homes. When buyer demand comes to an end, there’s no motivation to sell. Only those home owners who really need to move for personal, family or business reasons will do so.
Property booms can occur anytime and anywhere that the demand for housing outpaces the supply, but only investor led booms can turn into bubbles.
So what type of property boom are we in right now?
There’s a simple benchmark that tells us the type of boom taking place right now, and therefore what is likely to occur when the boom has ended.
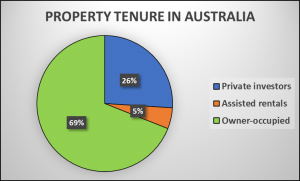
The benchmark is called tenure, a technical term that refers to the conditions by which homes are held or occupied.
The pie chart shows the percentage of homes privately rented, those rented from government agencies and those which are owner-occupied.
You can see that just over one quarter of homes in Australia are rented from private investors, so if the percentage of homes being bought by investors is lower than this, then owner-occupiers are driving buyer demand, but if the percentage climbs higher, then we are heading for an investor led boom and a possible bubble that could bust.
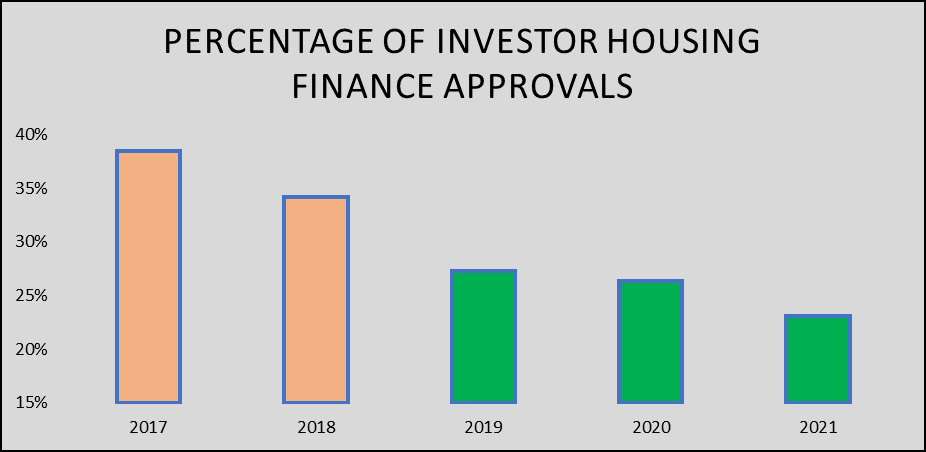
This next graph shows the percentage of homes being purchased by investors and reveals that they have been lower than the 26% benchmark since 2019, and also that the percentage of investors buying homes is declining.
Investor interest in residential property has waned in recent years because rental demand is falling and the yield from rent is too low. Investor interest has turned instead to high yielding investments such as shares, commodities and even commercial property. Owner-occupiers are not deterred by low rental yields, because they buy properties to live in, not to rent out.
The current mix of low interest rates, easy finance, reduced repayment buffers plus government incentives and waivers is causing the current surge in owner-occupier demand and when the new affordability ceilings are reached, growth will slow down and then end, but it won’t bust like a bubble.